Expert Homework Help With Statistics & AI Tools
Stuck on stats? Get expert homework help with statistics! Our guide provides step-by-step solutions, avoids common mistakes, and leverages AI.
You're probably here because a stats assignment has gone sideways.
Maybe the question looked harmless at first. Then you noticed a null hypothesis, three variables, a table that seems to have been designed by a chaos goblin, and software output that might as well be written in moon runes. At that point, “homework help with statistics” starts sounding less like a search term and more like a cry for help.
The good news is that stats homework usually feels harder than it is. The bad news is that stats punishes guessing. If you pick the wrong test, misread the variables, or interpret the result too dramatically, the whole thing wobbles. The way out isn't memorizing a hundred formulas. It's learning a repeatable way to think.
Staring at Stats and Seeing Static? Let's Fix That
It's late. Your tabs are multiplying. One says “difference between t-test and ANOVA.” Another says “what is p-value in simple words.” A third is just a stress snack recipe pretending to be academic research.

That feeling is common because stats homework rarely asks only for calculation. It asks you to read a situation, identify the kind of data, choose a method, and explain what the result means in normal human language. That's a lot of jobs for one assignment.
Why stats feels so weird
Statistics sits in an awkward middle zone. It's part math, part logic, part writing, and part “please explain what this output means without making things up.” That's why students often get stuck even when they can handle arithmetic.
A lot of help has moved online for exactly that reason. The statistics homework-help market has shifted from traditional human tutoring to 24/7 digital support and AI-guided assistance, and AI-based solvers now offer instant problem solving, image upload, and step-by-step explanations, so statistics help is no longer limited to live tutoring sessions, as described by .
The goal isn't to hunt for answers
The goal is to build a routine you can reuse when the wording changes.
Here's the mental shift that helps most:
- Stop asking “What formula do I use?” Ask what the problem is trying to find out.
- Stop starting with the numbers. Start with the variables and the question.
- Stop treating software output like gospel. Read it like a receipt. It tells you what happened, but only if you know what you ordered.
Practical rule: If you can explain the question in one plain-English sentence, you're already halfway to solving it.
When students get better at stats, they usually don't become calculation machines. They become better translators. They can move between the professor's wording, the data, the test, and the conclusion without panicking.
If your study routine itself is a mess, a simple cleanup helps more than people admit. This short read on is useful for building a less chaotic homework process.
What Kind of Beast Are You Fighting?
Before you solve anything, identify the species of problem in front of you. Stats homework is a zoo. If you mistake a giraffe for a lamppost, things go badly.
A lot of recurring trouble spots fall into hypothesis testing, sampling techniques, and experimental design, because they require both procedure and judgment about bias, representativeness, and inference quality, as noted in .
Read the verbs like a detective
Your professor usually leaves clues in the prompt. The verbs matter.
If the question says:
- “Compare” or “is there a difference”, you're probably looking at a group comparison.
- “Relationship” or “association”, you may be dealing with correlation, regression, or a categorical association test.
- “Predict”, regression often enters the room.
- “Summarize” or “describe”, you're likely in descriptive statistics territory.
- “Sample”, “bias”, or “design”, the issue may be the study setup, not the calculation.
A lot of stats confusion starts because students jump straight into formulas before naming the problem type. That's like grabbing a screwdriver because it looks smart.
Ask three triage questions
When I tutor students, I use three quick questions first.
What is the research question?
Write it in plain English. Not textbook English. Human English.What kind of variables are involved?
Are they categories, rankings, or numerical measurements?What is the assignment asking you to do?
Describe, compare, test, predict, or critique the design?
Those three questions narrow the field fast.
Common prompt patterns
Here's a quick way to classify what you're seeing.
When the prompt sounds vague, rewrite it as “I have ___ data and I want to know whether ___.”
That sentence forces clarity.
Don't ignore the design
Some homework problems look computational, but the core issue is the setup. If a sample is convenient instead of random, or if a confounder is obvious, you can get a neat-looking answer that still isn't persuasive. Professors love to test this because it reveals whether you understand statistics as reasoning, not just button-pushing.
That's why “homework help with statistics” should include more than finding a final number. The smarter move is to classify the problem first, then choose your method. Most wrong answers start earlier than students think.
Your Guide to Picking the Right Statistical Test
Once you know the kind of problem, the next headache arrives. Which test fits?
Many students get jammed up at this point. The names blur together. T-test, ANOVA, chi-square, correlation, regression. They all sound like side characters in a very boring superhero movie.
The cleanest workflow is this: define the question, identify variable types, clean the data, choose the correct test, compute the statistic, then interpret the result. Students often struggle less with arithmetic than with method selection and interpretation, as explained in .

Start with the data, not the test name
Ask two questions.
- What kind of data do I have?
- What do I want to find out?
That gives you a much better shot than trying to memorize a giant list.
Common Statistical Test Cheat Sheet
Quick interpretations that actually help
T-test
Use it when you want to compare the average of two groups on a numerical outcome.
Example: Do students using method A and method B earn different average quiz scores?
ANOVA
Use it when you're comparing more than two groups on a numerical outcome.
Example: Do three teaching methods lead to different average final project scores?
Chi-square test
Use it when both variables are categorical.
Example: Is study preference associated with class year?
Correlation
Use it when you want to measure the relationship between two numerical variables.
Example: Are hours studied and exam scores related?
Regression
Use it when you want to predict a numerical outcome, or explain how one or more variables relate to that outcome.
Example: Can attendance and homework completion predict course grade?
If your answer to “what am I comparing?” is groups, think t-test or ANOVA. If your answer is categories, think chi-square. If your answer is numbers moving together, think correlation or regression.
The mistake that wrecks everything
Students often choose a test because the name feels familiar, not because it matches the variables. That's why identifying variable type is non-negotiable. A ranked satisfaction score is not the same thing as a continuous measurement. A yes/no outcome behaves differently from a numeric score.
If you want a useful companion piece while sorting the data side of the problem, this walkthrough of helps you inspect what you're working with before you commit to a test.
Let's Solve a Problem Together From A to P-Value
Let's do a full walk-through in plain English.
Suppose your assignment says: a researcher wants to know whether a new study technique improves exam scores. One group used the new technique. Another used the usual approach. You need to decide how to analyze the results and explain the conclusion.
Step 1, translate the prompt
Don't start with formulas. Start by rewriting the question.
We have two groups of students. We have numerical scores. We want to know whether the average scores differ.
That points us toward an independent t-test.
Step 2, write the hypotheses like a normal person
The null hypothesis says there's no difference in average exam scores between the groups.
The alternative hypothesis says there is a difference.
If your professor specifically says “improves,” check whether they want a directional claim or a general difference. If the assignment doesn't clearly justify a one-tailed test, don't assume one. A lot of points vanish right there.
Step 3, check whether the test makes sense
Before running the test, ask:
Are the groups independent?
They should be separate groups, not the same students measured twice.Is the outcome numerical?
Exam scores usually are.Do the data look wildly broken?
Scan for impossible values, missing entries, or weird coding mistakes.
Stats begins acting like detective work again. If the setup is wrong, the test result won't rescue you.
Step 4, compute and read the output
Maybe your calculator, software, or class platform gives you a test statistic and a p-value. Students usually freeze at the p-value, so here's the practical translation:
A small p-value suggests the observed difference would be less likely if there were really no difference between groups.
That does not mean the new method “definitely works.” It means the data provide evidence against the null hypothesis.
Say “the data suggest a difference” before you say anything stronger. That habit saves you from overclaiming.
If your class also covers proportion questions instead of mean comparisons, this is a solid side resource because it shows how inference works in context, not just symbol-pushing.
Step 5, write the conclusion your professor wants
Most students lose marks here because they stop at the number.
A better conclusion sounds like this:
- Weak version: “The p-value was small, so we reject the null.”
- Better version: “The analysis suggests a difference in average exam scores between students who used the new study technique and those who did not.”
- Best classroom version: “Based on the test, the data suggest the study technique is associated with different average exam scores, though the result should be interpreted in the context of the study design and assumptions.”
That third version sounds careful because it is careful. Stats likes careful.
Where tools help without doing the thinking for you
A good solver can help you check whether your variable setup matches your chosen method, explain what the output means, or generate the steps in software. If you want help translating a prompt into method, output, and explanation, this is useful for seeing how that workflow can look.
Why Your Answer is Wrong Common Stats Mistakes
A wrong stats answer often feels weird before it looks wrong. The conclusion sounds too dramatic. The p-value sentence feels off. The graph says one thing and your write-up says another. That's your cue to debug.

Symptom, diagnosis, cure
My conclusion sounds way too dramatic
Diagnosis: You treated correlation like causation, or treated a statistical result like proof of a big real-world effect.
Cure: Use calmer language. “Associated with” beats “caused by” unless the design really supports causation.
I think the p-value means the chance I'm wrong
Diagnosis: Classic mix-up.
Cure: The p-value is not “the probability your hypothesis is false.” It tells you how surprising the data would be under the null hypothesis. That's less catchy, but it's correct.
I picked a test because I recognized the name
Diagnosis: Method-first thinking.
Cure: Go back to the variables. Name the data type and the goal before touching the test.
My software gave an answer, so I assumed it's fine
Diagnosis: Blind trust in output.
Cure: Software is fast, not wise. It won't always stop you from feeding a categorical variable into the wrong procedure or misunderstanding coding choices.
A clean-looking table can still hide a messy idea.
A tiny pre-submission checklist
Run through this before you turn anything in:
- Question match: Does your chosen test answer the exact question asked?
- Variable sanity: Did you correctly identify categorical versus numerical variables?
- Assumptions check: Did you ignore any obvious issue with the design or data?
- Interpretation check: Did you explain the result in context, not just report a value?
- Language check: Did you overclaim?
The design trap
Some homework answers are technically neat but scientifically weak. A convenience sample, a confounder, or a poorly chosen comparison can make your interpretation shaky even if the arithmetic is fine.
If you need a better sense of how to inspect data and results with fewer blind spots, this guide on is a practical follow-up.
Smarter Homework Help Using AI Responsibly
AI can help with statistics homework. It can also help you learn absolutely nothing if you use it like a vending machine for answers.
The more useful approach is to treat AI like a study buddy who explains, checks, and helps you debug. The primary gap students often face is getting help that shows how to do it in their actual tool and explain why, especially as AI tutoring keeps moving toward explainable, reproducible support, as discussed in .

A better AI workflow for stats homework
Try this instead of pasting the whole assignment and hoping for mercy.
Read the prompt first
Identify the variables and what the problem asks.Ask for concept help
Prompt the AI to explain the difference between the likely methods in simple language.Request a method check
Ask, “Given one categorical grouping variable and one numerical outcome, what tests are commonly used and why?”Use it to verify your interpretation
Paste your conclusion and ask whether it overstates the result.Translate into software steps
Ask for the workflow in R, Python, SPSS, or Excel if your class requires reproducible work.
Keep the output human
If you use AI to draft explanations, rewrite them in your own voice. Stats instructors can usually spot generic AI prose from orbit. If you want a cleanup pass on stiff wording, a tool like can help smooth robotic phrasing before you revise it yourself.
One realistic tool setup
For students handling notes, prompts, and code in one place, Zemith can fit into this workflow by letting you chat with documents, generate summaries or flashcards from course material, and use coding support to produce and explain analysis steps. That's useful when you need to move from theory to software without juggling a pile of tabs.
Use AI to ask better questions, not to avoid having questions.
If you want practice writing better prompts for explanation, checking, and follow-up questions, this guide on is a practical place to start.
Stats homework feels brutal when every problem looks different. Underneath, the pattern is usually the same. Identify the question, classify the variables, choose the method that fits, and explain the result like a careful human being. If you want one workspace to help with documents, explanations, coding steps, and study materials while you work through that process, try .
Explore Zemith Features
Every top AI. One subscription.
ChatGPT, Claude, Gemini, DeepSeek, Grok & 25+ more


Always on, real-time AI.
Voice + screen share · instant answers
What's the best way to learn a new language?
Immersion and spaced repetition work best. Try consuming media in your target language daily.
Voice + screen share · AI answers in real time
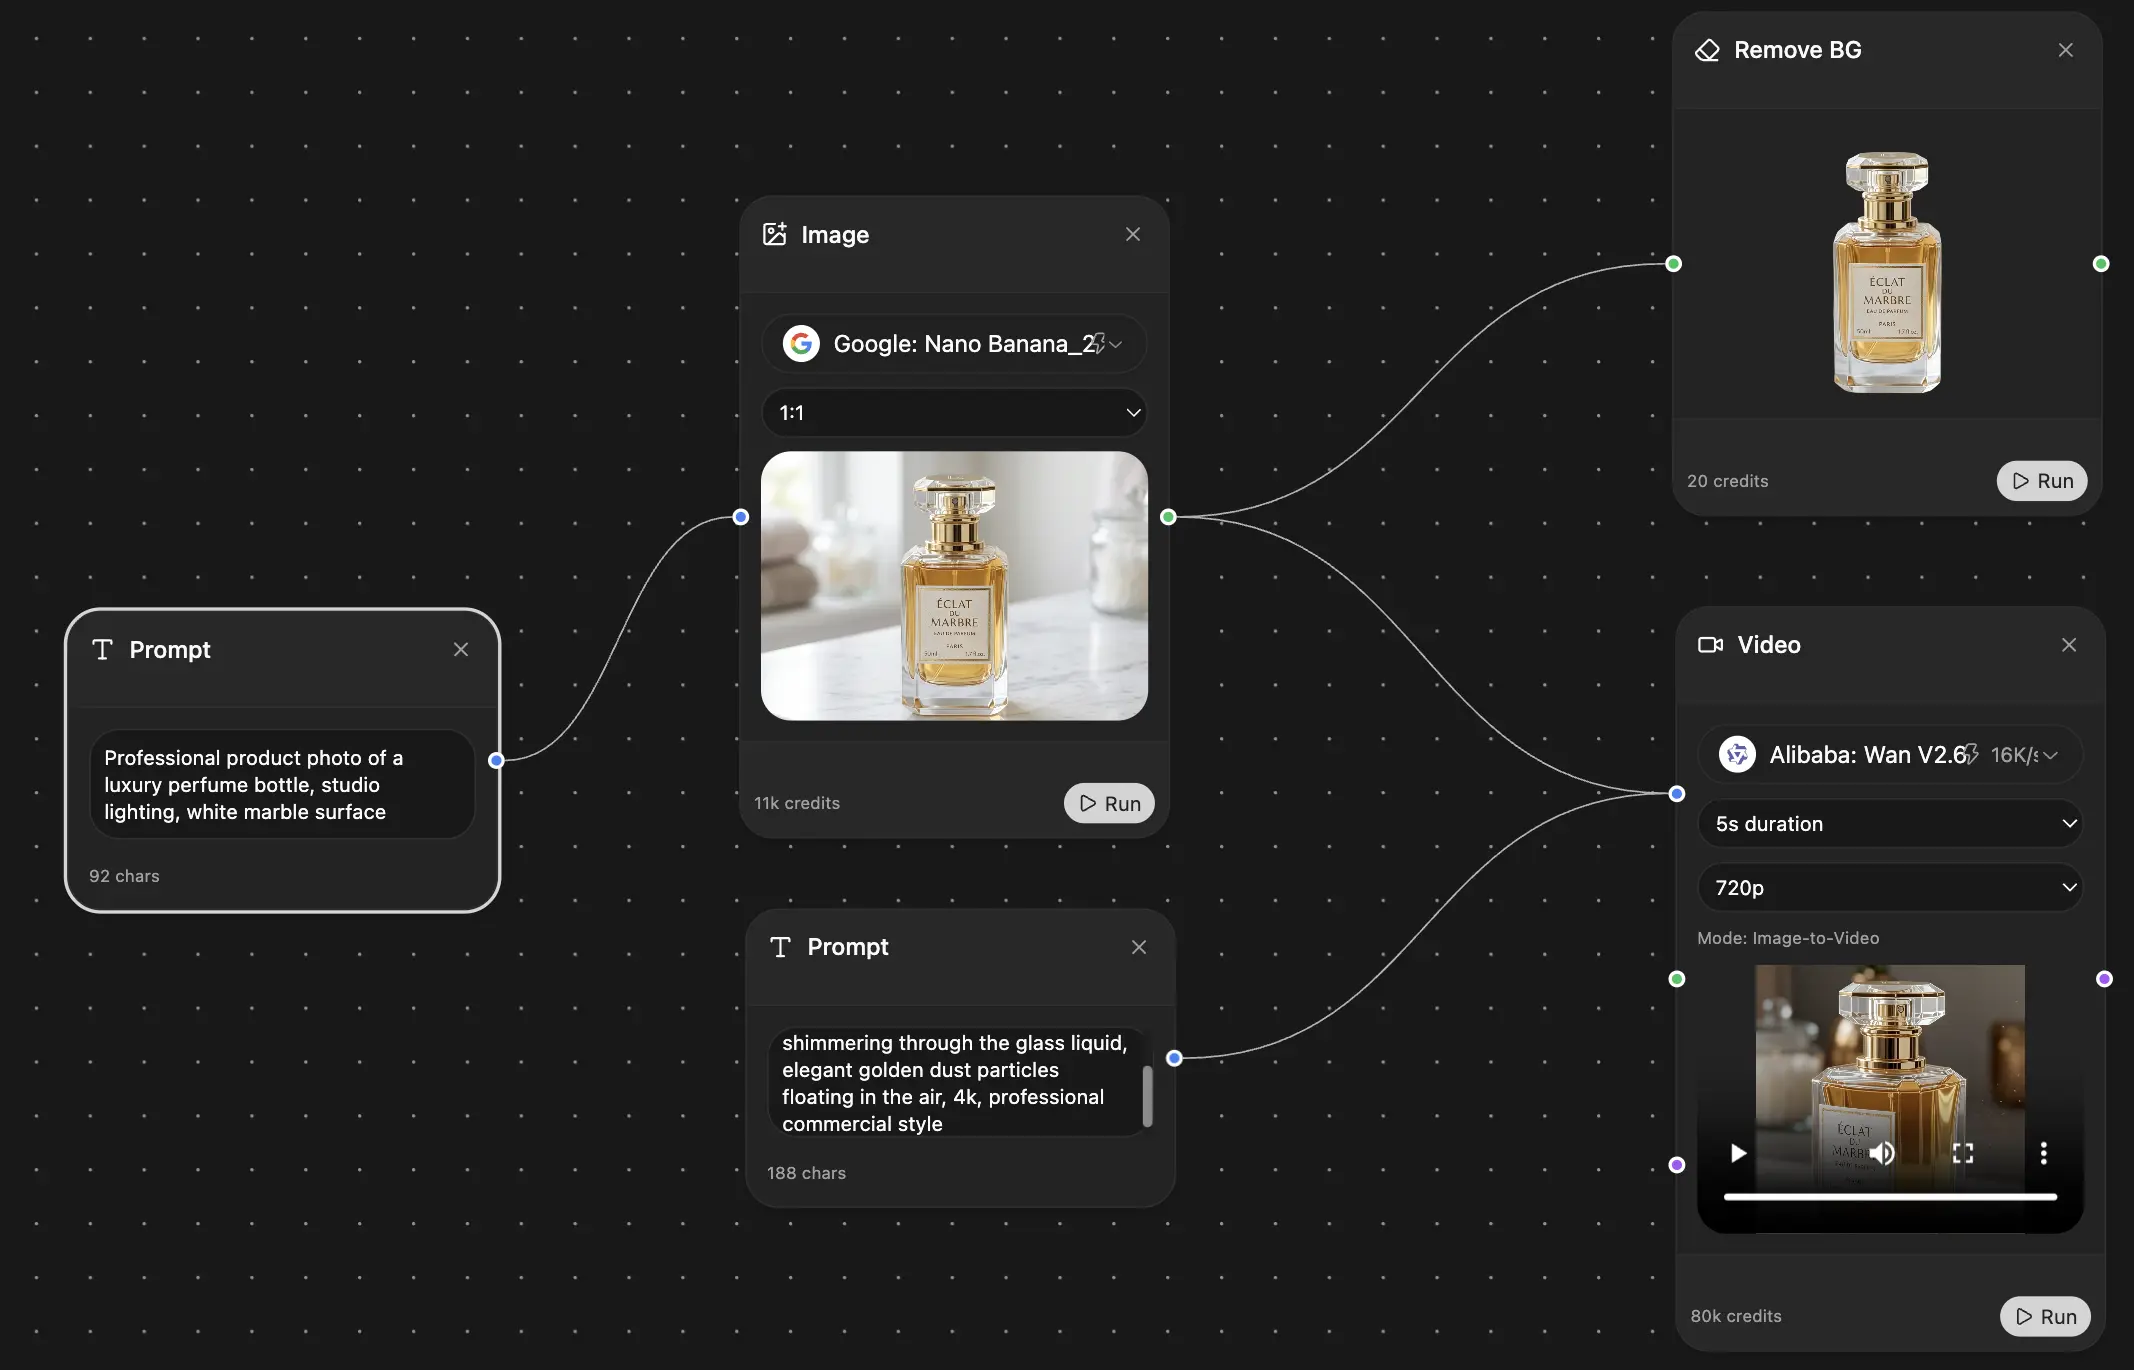
Image Generation
Flux, Nano Banana, Ideogram, Recraft + more

Write at the speed of thought.
AI autocomplete, rewrite & expand on command
Any document. Any format.
PDF, URL, or YouTube → chat, quiz, podcast & more
Video Creation
Veo, Kling, Grok Imagine and more

Text to Speech
Natural AI voices, 30+ languages
Code Generation
Write, debug & explain code
Chat with Documents
Upload PDFs, analyze content
Your AI, in your pocket.
Full access on iOS & Android · synced everywhere
Your infinite AI canvas.
Chat, image, video & motion tools — side by side
Save hours of work and research
Transparent, High-Value Pricing
Trusted by teams at
Free
No credit card required
- 100 credits daily
- 3 AI models to try
- Basic AI chat
Plus
- 1,000,000 credits/month
- 25+ AI models — GPT, Claude, Gemini, Grok & more
- Agent Mode with web search, computer tools and more
- Creative Studio: image generation and video generation
- Project Library: chat with document, website and youtube, podcast generation, flashcards, reports and more
- Workflow Studio and FocusOS
Professional
- Everything in Plus, and:
- 2,100,000 credits/month
- Pro-exclusive models (Claude Opus, Grok 4, Sonar Pro)
- Motion Tools & Max Mode
- First access to latest features
- Access to additional offers
What Our Users Say
Great Tool after 2 months usage
"I love the way multiple tools they integrated in one platform. Going in the right direction."
— simplyzubair
Best in Kind!
"The quality of data and sheer speed of responses is outstanding. I use this app every day."
— barefootmedicine
Simply awesome
"The credit system is fair, models are perfect, and the discord is very responsive. Quite awesome."
— MarianZ
Great for Document Analysis
"Just works. Simple to use and great for working with documents. Money well spent."
— yerch82
Great AI site with accessible LLMs
"The organization of features is better than all the other sites — even better than ChatGPT."
— sumore
Excellent Tool
"It lives up to the all-in-one claim. All the necessary functions with a well-designed, easy UI."
— AlphaLeaf
Well-rounded platform with solid LLMs
"The team clearly puts their heart and soul into this platform. Really solid extra functionality."
— SlothMachine
Best AI tool I've ever used
"Updates made almost daily, feedback is incredibly fast. Just look at the changelogs — consistency."
— reu0691