Top Qualitative Data Analysis Methods for Actionable Insights
Learn key qualitative data analysis methods to uncover stories in your data. Discover how to select and apply techniques for meaningful insights.
Qualitative data analysis is all about making sense of information that isn’t numbers. We’re talking about things like interview transcripts, open-ended survey answers, and notes from observations. Unlike quantitative analysis, which is focused on cold, hard data, qualitative methods are designed to get to the heart of why people do what they do. It’s about digging into the context, emotions, and stories to find actionable insights. The goal is to spot patterns, pull out themes, and build a strategy from what it all means.
Demystifying Qualitative Data Analysis

Think of yourself as a detective trying to solve a complex case. That's a great way to picture qualitative data analysis. You start with a pile of seemingly random clues—interview recordings, field notes, diary entries, or maybe a bunch of social media comments. Your mission is to sift through everything, piece together the evidence, and build a compelling story that points to clear, strategic actions.
This whole process is a journey. You're taking messy, unstructured text and turning it into clear, strategic insights. It demands careful reading, a bit of critical thinking, and a structured plan to make sense of genuine human experiences and turn them into business intelligence.
The Core Purpose of Qualitative Analysis
The real aim here is to go deeper than what the numbers on a spreadsheet can tell you. A quantitative survey might show that 70% of your customers are satisfied, but qualitative analysis tells you why, providing the actionable insights needed to improve. It’s how you discover the specific features they rave about, the emotional connection they feel with your brand, and the real-world situations where they use your product.
This kind of analysis is essential for answering the big questions that drive business growth:
- What truly motivates our customers to make a purchase?
- What are the subtle frustrations and delights in our user experience?
- Are there underlying cultural trends we should be capitalizing on?
- How can we build detailed, authentic personas to guide marketing and product development?
Basically, it adds the color and context you need to make smarter, data-driven decisions. Without it, you’re only getting half the story.
Qualitative data analysis is the art of transforming raw, narrative data into a compelling story that reveals underlying patterns and meanings. It’s the bridge between what people say and what your business should do next.
Moving from Raw Data to Actionable Insights
Getting from a mountain of raw data to a handful of powerful insights is a step-by-step process. First, researchers really immerse themselves in the material. They read and re-read, systematically organizing the data and "coding" it to flag recurring concepts. It’s a bit like sorting through hundreds of customer reviews; you might create tags for every mention of "slow shipping," "easy checkout," or "helpful support."
Once you have your codes, you start grouping them into broader themes, which become the building blocks of your analysis. For instance, those initial tags could be clustered into larger themes like "Logistics Experience" or "Customer Service Quality." This structured method turns a chaotic pile of text into an organized framework. For anyone facing this challenge, platforms like are a game-changer. These tools act as a central hub to organize, code, and map out narrative threads, helping you spot meaningful patterns much faster and translate them directly into actionable business strategies.
How to Choose the Right Qualitative Analysis Method
Picking the right qualitative analysis method is a lot like choosing the right lens for a camera. Each one gives you a unique perspective, bringing different parts of your subject into sharp focus. This decision is critical—it directly shapes the story your data tells and the actionable insights you ultimately uncover.
It's not about finding the single "best" method. Instead, it's about finding the best fit for your specific research goals. Are you trying to systematically sort through a huge volume of text, or do you need to understand the deeply personal journey of an individual? Your answer will guide you to the perfect analytical approach.
The Five Core Qualitative Analysis Methods
To help you make that choice, let's walk through five foundational methods. Each one serves a distinct purpose. Getting a feel for their strengths will help you line up your approach with your research questions. Think of them less as rigid boxes and more as flexible toolkits designed for different jobs.
First, it helps to see where the data for these analyses even comes from. The image below shows the most common ways researchers gather qualitative data in the first place.
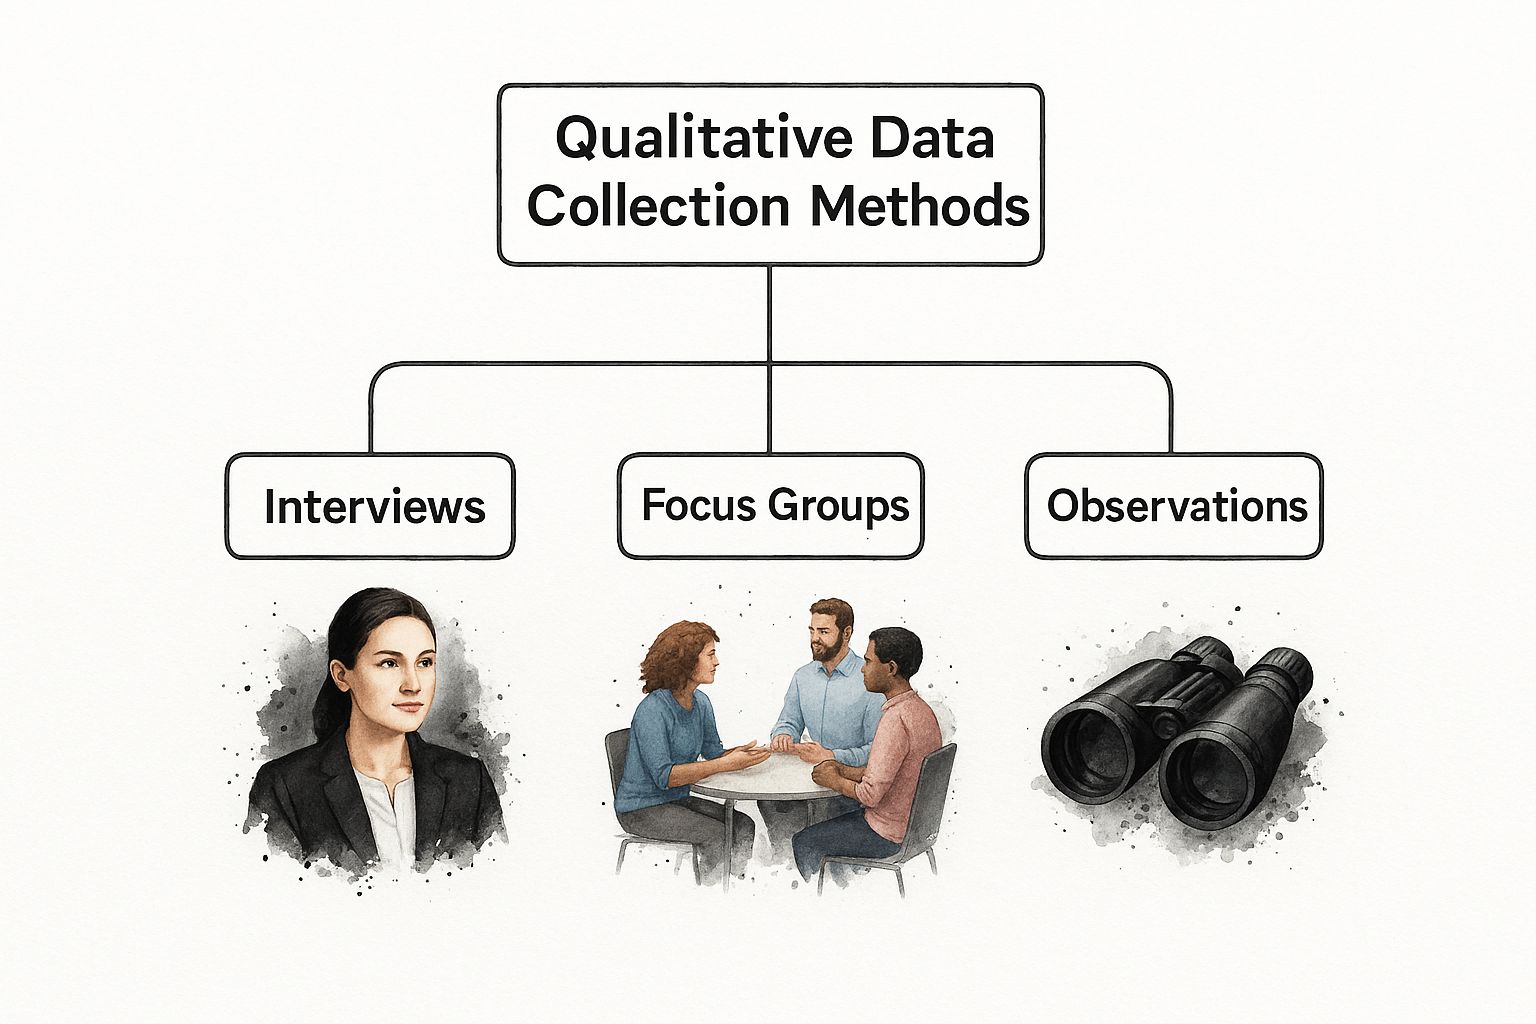
As you can see, techniques like interviews, focus groups, and observations are the starting blocks. They generate the rich, detailed data that you'll eventually dig into with one of the following methods.
1. Thematic Analysis: Finding the Patterns
Thematic analysis is easily one of the most popular and flexible methods out there. The main goal is simple: identify, analyze, and report on the patterns—or themes—that pop up in your data. It's a fantastic starting point for anyone new to qualitative research because it’s so straightforward yet incredibly powerful for generating insights.
Let’s say you’ve just interviewed 20 customers about their experience with your new mobile app. Using thematic analysis, you’d comb through the transcripts, "coding" or tagging recurring comments about usability, design, or performance. After a while, you’d start grouping these codes into bigger themes, like "User Onboarding Challenges" or "Positive Feedback on Speed," which directly inform product improvements.
This method isn’t new. By the 1980s and 1990s, it was already a well-established way to systematically make sense of textual data. Because it’s so focused on identifying recurring ideas, it’s now used in over 60% of qualitative studies.
2. Content Analysis: Systematically Categorizing Your Data
Content analysis takes a more systematic, and sometimes even quantitative, approach to qualitative data. It’s all about categorizing and counting how often specific words, concepts, or themes appear in texts, images, or even videos. This method is perfect when you need to turn qualitative insights into hard numbers to support strategic decisions.
Imagine a marketing team analyzing 100 blog posts from a competitor. They could use content analysis to track how often keywords like "sustainability," "innovation," or "customer-centric" are mentioned. The final result might be a simple chart showing which competitor talks about "innovation" the most—a clear, data-driven insight that informs their own content strategy.
Key Takeaway: While thematic analysis is trying to understand the meaning behind the patterns, content analysis often focuses on the frequency of specific elements. This makes it a great choice for turning large volumes of text into actionable metrics.
3. Narrative Analysis: Understanding the Stories
We humans make sense of the world through stories. Narrative analysis is the method dedicated to interpreting those stories, zeroing in on how people build and share their experiences. It examines the structure of a story, the specific language used, and the context it’s told in.
This approach is invaluable when you want to understand an individual's experience in great depth. A healthcare researcher, for instance, might use it to study the personal accounts of patients living with a chronic illness. By analyzing how they tell their stories—the turning points, the emotional arcs, the key players—the researcher can gain insights into the lived experience that lead to better patient care strategies.
4. Grounded Theory: Building New Theories from Scratch
Grounded theory is unique. Its primary goal isn't just to analyze data but to develop a brand-new theory from that data. You don't start with a hypothesis. Instead, you start with the data and let the theories emerge naturally through a careful process of coding and comparison.
It's a very iterative method. A sociologist studying workplace culture might conduct interviews and observations, constantly comparing new data with the categories that are starting to form. Through this "constant comparative method," they could develop a novel theory explaining how remote work policies actually impact team collaboration. It's a bottom-up approach that works wonders when you're exploring new territory to find innovative strategies.
5. Discourse Analysis: Examining Language and Power
Discourse analysis looks beyond what is said to examine how it is said. It explores the way language is used in social contexts to create meaning, establish power dynamics, and shape perspectives. This method treats language not just as a communication tool, but as a form of social action.
A political analyst, for example, could use discourse analysis to study a politician's speeches. They wouldn't just list the topics discussed; they would analyze the specific words, metaphors, and rhetorical tricks used to frame issues and persuade the audience. For businesses, this can reveal how competitor messaging shapes market perceptions, providing actionable intelligence for brand positioning.
To wrap things up, here’s a quick-glance table to help you compare these five methods and see which one might be the best match for your research.
How to Choose Your Qualitative Analysis Method
Ultimately, choosing the right method comes down to your research question. Modern tools can make this process much smoother. For instance, platforms like are built to support all of these approaches by giving you a flexible space to organize, code, and connect your ideas. By handling the data management, these tools let you focus on what really matters—uncovering the actionable insights that drive your business forward. And with the growth of AI, you can now that are making these complex workflows more accessible than ever.
Your Step-By-Step Guide to Thematic Analysis

Of all the qualitative data analysis methods out there, thematic analysis is one of the most popular—and for good reason. It’s incredibly flexible and intuitive for turning raw text into clear business direction. Think of it like organizing a massive, messy closet. You start with a giant pile of clothes (your data), sort them into smaller piles like shirts, pants, and socks (codes), and then group those piles into larger categories like "work clothes" and "gym wear" (themes).
This approach is fantastic for digging out meaningful patterns from a large set of qualitative data. It’s less about following a rigid formula and more about a structured, yet creative, process of discovery. Let's walk through the six common steps that will turn what feels like a mountain of text into clear, actionable insights.
Step 1: Get to Know Your Data Inside and Out
Before you can start analyzing anything, you have to truly immerse yourself in the data. This isn’t just a quick skim. It means reading and re-reading your interview transcripts, poring over survey responses, or reliving your field notes.
The goal here isn't to jump to conclusions. It's to develop a deep, intuitive feel for the material. If you have dozens of customer interview transcripts about a new product, you’d listen to the recordings or read through everything to absorb the tone, the language people use, and the core ideas that keep popping up. This initial soak is the foundation for everything that follows.
Step 2: Start Generating Initial Codes
Now the real sorting begins. Coding is simply the process of attaching short, descriptive labels to interesting chunks of your data. A good code captures the essence of a sentence or a paragraph. It's like highlighting a key passage in a book and jotting a keyword in the margin.
Going back to our customer interviews, you might create codes like:
- "Confusing checkout process"
- "Loved the sleek design"
- "Feature request for dark mode"
This is exactly where a tool like Zemith makes a huge difference. Instead of drowning in spreadsheets or sticky notes, you can upload transcripts and apply digital tags directly to the text. It keeps your codes organized and tied to the original source, saving hours of manual work and ensuring no potential insight is lost.
Step 3: Search for Potential Themes
Once you have a solid list of codes, it’s time to zoom out and look for the bigger picture. This step is all about grouping your individual codes into broader, more meaningful potential themes. Imagine taking all your brainstorming sticky notes and starting to cluster them together on a whiteboard.
For instance, codes like "confusing checkout," "slow loading times," and "payment error" could all be gathered under a potential theme called "Technical Frustrations." In the same way, "sleek design," "intuitive layout," and "appealing colors" might form a theme you tentatively label "Positive Aesthetic Feedback."
A theme is more than just a summary; it's a compelling pattern that captures a significant aspect of the data related to your research question. It tells a part of the overall story that can guide your next steps.
Step 4: Review and Refine Your Themes
Those first themes you came up with? They're just a draft. Now it’s time to kick the tires and see if they hold up. This happens on two levels.
First, you need to look at all the coded snippets within each theme. Do they really belong together? Is there a coherent, consistent pattern? Second, you have to review your themes against the entire dataset. Do they accurately capture the main story? You might find some themes are too broad and need to be split, while others are too narrow and should be merged. This is an iterative process of tweaking and refining your thematic map until it feels right.
Step 5: Define and Name Your Themes
With your themes solidified, it's time to give them final, polished names and clear definitions. For each theme, write a detailed paragraph that explains exactly what it means, why it’s important, and how it connects to your other themes.
A well-defined theme tells a story on its own. Instead of something generic like "Technical Frustrations," a more actionable name might be "Checkout Friction Undermines User Confidence." It’s far more descriptive and immediately communicates a powerful insight that the product team can act on.
Step 6: Produce Your Final Report
This is where you bring it all home. The final step is to weave your themes into a coherent and compelling narrative, backed up with direct quotes from your data as evidence. Your job is to tell the story you uncovered and clearly state the business implications.
How you present that story is crucial. Using charts and visuals can help illustrate the relationships between themes and highlight the frequency of certain ideas. To make your report as impactful as possible, you’ll want to and ensure your insights resonate with your audience. With a platform like Zemith, you can easily export your findings and build reports that translate qualitative data into clear, actionable recommendations.
How to Perform an Effective Content Analysis
While thematic analysis hunts for deeper, underlying meanings, content analysis is all about systematically counting and categorizing what's right there on the surface. It’s a powerful method for turning qualitative sources—like customer reviews, social media posts, or competitor websites—into hard, quantifiable data that can drive strategy.
Essentially, you're taking unstructured text and making it measurable. This approach is perfect when you need to know how often certain words, ideas, or themes appear, giving you a structured and repeatable way to track them.
Imagine you're trying to figure out the content strategy of your top three competitors. Instead of just getting a "vibe" from their websites, content analysis gives you a framework to do it methodically. You're not just guessing at their messaging; you're building an evidence-based inventory of what they prioritize. It's a way to turn fuzzy observations into solid, comparable metrics that inform your own marketing.
Define Your Research Question
Before you even think about looking at the data, you need a rock-solid research question. A vague goal like, "I want to see what my competitors are writing about," is a recipe for a messy, unfocused analysis that goes nowhere. A sharp, precise question gives your work purpose and keeps you on track.
For our competitor analysis example, a much stronger question would be: "What are the most frequent value propositions our top three competitors emphasize on their website homepages?" See the difference? This question is specific, it's measurable, and it guides every single step that follows. You know exactly what you’re looking for (value propositions) and where to find it (homepage content).
Think of your research question as the compass for your entire project. Without it, you’re just wandering through data without a destination.
Develop a Robust Coding Scheme
The real heart of content analysis is your coding scheme, sometimes called a coding frame. This is simply a set of predefined categories—or codes—that you'll use to sort the content. It's like setting up a series of labeled buckets. As you go through the data, you'll drop each relevant piece of information into the right bucket.
Sticking with the competitor example, your coding scheme might include categories like:
- Cost Savings: Mentions of "affordable," "discount," "save money," "low price."
- Time & Efficiency: Phrases like "save time," "quick setup," "streamlined," "fast."
- Innovation & Tech: Words such as "cutting-edge," "new technology," "advanced," "next-gen."
- Customer Support: References to "24/7 help," "dedicated team," "expert support."
The goal here is to make your codes crystal clear and distinct from one another. Everyone on the team needs to have the exact same understanding of what "Cost Savings" means, otherwise, your results won't be consistent.
Systematically Code and Interpret the Results
With your coding scheme in hand, the real work begins. You'll go through each piece of content—in this case, each competitor's homepage—and apply the appropriate code every time a relevant concept appears. This is a careful, meticulous process of counting and classifying.
Consistency is the cornerstone of credible content analysis. If multiple researchers are involved, even small differences in how they interpret codes can skew the results. This makes a unified process absolutely critical.
This is where having a centralized workspace is a game-changer. When everyone is working from the same playbook, your analysis becomes far more rigorous and reliable. For instance, in a platform like Zemith, you can build your coding framework directly into the tool, ensuring every team member applies the codes in the exact same way for consistent, dependable results.
The process of sifting through massive amounts of text, like customer feedback, can also be greatly accelerated with the right tools. It's worth exploring how can help you get to insights faster.
Once the coding is done, you move on to interpretation. You might build a simple table showing that Competitor A mentioned "Cost Savings" 15 times, while Competitor B hammered home "Innovation" 22 times. Suddenly, you have clear, data-backed insights. Competitor A is clearly positioning itself as the budget-friendly choice, while Competitor B is going all-in on being the technology leader. That's the unique power of content analysis: turning words into actionable intelligence.
How to Ensure Your Qualitative Research Is Trustworthy

So, you’ve dug into your qualitative data and uncovered some really compelling patterns. Now for the big question: how do you convince everyone else that your findings are credible and worth acting on?
Unlike quantitative research, you can't just point to a statistical test. In the qualitative world, it's all about demonstrating rigor and building trustworthiness. At the end of the day, your insights are only as good as the confidence your stakeholders have in them.
This isn't just some academic box-ticking exercise; it's a practical necessity. Building trust means showing your work, being honest about your own perspective, and methodically checking your conclusions. These steps are what elevate your analysis from a personal interpretation to a defensible, evidence-based strategy.
The Bedrock of Credibility
Three core practices are absolutely essential for making your qualitative research trustworthy. By weaving them into your process from the start, you ensure your final report is not just insightful, but solid and reliable. Think of them as the quality control checks for your entire analysis.
And these techniques are more important than ever. Market research shows a significant shift, with qualitative methods growing from about 30% of all data analysis back in 2010 to nearly 45% by 2023. This boom is fueled by a need for deeper customer insights, which brings a much greater demand for results that people can actually verify. You can read more on this trend in the .
"Trustworthiness is the qualitative researcher's equivalent to validity and reliability. It’s the meticulous process of demonstrating that your findings are worth paying attention to and acting upon."
3 Pillars of Research Rigor
To make your research bulletproof, focus on building these three pillars into your process right from the get-go.
Maintain a Clear Audit Trail: Think of this as your research diary. An audit trail meticulously documents every decision you make along the way—from how you created your first codes to why you decided to merge two themes. It creates a transparent roadmap from your raw data to your final conclusions, letting anyone follow your logic.
Practice Reflexivity: In qualitative research, you are the main analytical tool. That's a huge responsibility. Reflexivity is the practice of constantly examining your own biases, assumptions, and life experiences. By acknowledging how your unique perspective might be shaping the interpretation, you actually make your findings more objective and honest.
Use Triangulation: Never, ever rely on a single piece of evidence. Triangulation is all about cross-verifying your findings. You can do this by using multiple data sources (like interviews and focus groups), having different researchers analyze the data, or applying various analytical methods. When different paths all lead to the same conclusion, your confidence in that finding skyrockets.
Pulling all this off requires fantastic organization. A structured approach is non-negotiable, and you can to get that solid foundation in place.
Tools like Zemith are actually built to support these quality checks. Its features for memoing and annotating make it simple to build a detailed audit trail and practice reflexivity as you work. Plus, the organized workspace helps with triangulation by letting you easily compare data from different sources, empowering you to produce trustworthy research that stakeholders can act on with 100% confidence.
Frequently Asked Questions About Qualitative Data Analysis
Diving into qualitative data analysis for the first time—or even the tenth—can bring up some tricky questions. It's completely normal to find yourself wondering if you're on the right track, second-guessing your sample size, or trying to figure out where one method ends and another begins. This just means you're committed to getting it right.
Let's tackle some of the most common questions head-on. Getting clear on these points will not only boost your confidence but also sharpen your skills as a researcher.
How Is Qualitative Different From Quantitative Analysis?
The easiest way to think about it is "why" versus "what."
Quantitative analysis is all about the "what." It works with numbers and stats to show you the big picture. For example, it can tell you that 75% of your users clicked away from their shopping cart. That's a crucial "what," but it doesn't tell you the whole story.
That's where qualitative analysis comes in. It answers the "why." It gets into the real-world context, the motivations, and the feelings behind the numbers. It’s how you discover why those users left, uncovering reasons like "the shipping costs were a surprise" or "the checkout process was confusing." One gives you scale, the other gives you the deep insights needed for action.
What's the Right Sample Size for a Qualitative Study?
This is a classic question, but the answer isn't a magic number. Unlike quantitative research that needs large numbers for statistical power, qualitative research is about depth, not just breadth. The guiding principle here is data saturation.
Data saturation is the point where you stop hearing new things. When new interviews or observations start repeating the same themes you've already uncovered, you're likely there.
The ideal sample size really depends on what you're trying to learn:
- A deeply personal case study might only involve a single person.
- If you're exploring a specific user journey, you might aim for 10-15 interviews.
- A broad ethnographic study could involve dozens of participants over several months.
Ultimately, the goal is rich, detailed information, not just a high participant count.
How Do I Know Which Method to Use?
Your research question is your North Star. The right method is simply the one that best helps you answer that question. We’ve walked through several different qualitative data analysis methods, and each is designed for a specific job.
Start by asking yourself what you want to discover:
- Looking for common patterns across a set of interviews or feedback surveys? Thematic analysis is your go-to.
- Need to systematically count and categorize specific words or topics in documents? Content analysis is built for that.
- Want to understand the story of someone's personal experience or journey? Narrative analysis will get you there.
Let your objective lead the way.
Don't make the common mistake of picking a method and trying to force your data into it. Let your research question guide your choice. This ensures the way you analyze your data is perfectly aligned with what you're trying to find out.
Trying to manage all this—from picking a method to sifting through hours of interviews—can be overwhelming. Juggling spreadsheets, word docs, and sticky notes makes it far too easy to miss important connections in your data. This is exactly why modern research platforms like Zemith exist. They give you a single, AI-powered space to organize, code, and see your findings come to life, so you can focus on the story your data is telling, not the logistics of managing it.
Ready to stop juggling spreadsheets and start uncovering insights faster? Zemith provides an all-in-one AI platform to organize your research, analyze your data, and turn complex information into clear, actionable results. Explore how our smart tools can support every step of your qualitative analysis journey. Visit to learn more.
Explore Zemith Features
Every top AI. One subscription.
ChatGPT, Claude, Gemini, DeepSeek, Grok & 25+ more


Always on, real-time AI.
Voice + screen share · instant answers
What's the best way to learn a new language?
Immersion and spaced repetition work best. Try consuming media in your target language daily.
Voice + screen share · AI answers in real time
Image Generation
Flux, Nano Banana, Ideogram, Recraft + more

Write at the speed of thought.
AI autocomplete, rewrite & expand on command
Any document. Any format.
PDF, URL, or YouTube → chat, quiz, podcast & more
Video Creation
Veo, Kling, Grok Imagine and more

Text to Speech
Natural AI voices, 30+ languages
Code Generation
Write, debug & explain code
Chat with Documents
Upload PDFs, analyze content
Your AI, in your pocket.
Full access on iOS & Android · synced everywhere
Your infinite AI canvas.
Chat, image, video & motion tools — side by side
Save hours of work and research
Transparent, High-Value Pricing
Trusted by teams at
Free
No credit card required
- 100 credits daily
- 3 AI models to try
- Basic AI chat
Plus
- 1,000,000 credits/month
- 25+ AI models — GPT, Claude, Gemini, Grok & more
- Agent Mode with web search, computer tools and more
- Creative Studio: image generation and video generation
- Project Library: chat with document, website and youtube, podcast generation, flashcards, reports and more
- Workflow Studio and FocusOS
Professional
- Everything in Plus, and:
- 2,100,000 credits/month
- Pro-exclusive models (Claude Opus, Grok 4, Sonar Pro)
- Motion Tools & Max Mode
- First access to latest features
- Access to additional offers
What Our Users Say
Great Tool after 2 months usage
"I love the way multiple tools they integrated in one platform. Going in the right direction."
— simplyzubair
Best in Kind!
"The quality of data and sheer speed of responses is outstanding. I use this app every day."
— barefootmedicine
Simply awesome
"The credit system is fair, models are perfect, and the discord is very responsive. Quite awesome."
— MarianZ
Great for Document Analysis
"Just works. Simple to use and great for working with documents. Money well spent."
— yerch82
Great AI site with accessible LLMs
"The organization of features is better than all the other sites — even better than ChatGPT."
— sumore
Excellent Tool
"It lives up to the all-in-one claim. All the necessary functions with a well-designed, easy UI."
— AlphaLeaf
Well-rounded platform with solid LLMs
"The team clearly puts their heart and soul into this platform. Really solid extra functionality."
— SlothMachine
Best AI tool I've ever used
"Updates made almost daily, feedback is incredibly fast. Just look at the changelogs — consistency."
— reu0691