8 Actionable Data Visualization Best Practices for 2025
Discover 8 essential data visualization best practices to create clear, impactful charts. Learn actionable tips for better storytelling and decision-making.
In a data-driven world, presenting information clearly isn't just a skill; it's a superpower. The difference between a confusing chart and an insightful one can mean the difference between a missed opportunity and a breakthrough decision. Effective data visualization cuts through the noise, transforms raw numbers into compelling narratives, and ensures your data makes the impact it deserves. This is where mastering a core set of data visualization best practices becomes essential.
This guide moves beyond theory to provide actionable steps you can immediately apply, from choosing the right chart type to telling a clear story with your data. Whether you're a seasoned analyst building complex dashboards or a marketer creating a report, these principles will elevate your ability to communicate complex information effectively. For those interested in domain-specific applications, exploring can offer valuable insights into presenting complex data effectively.
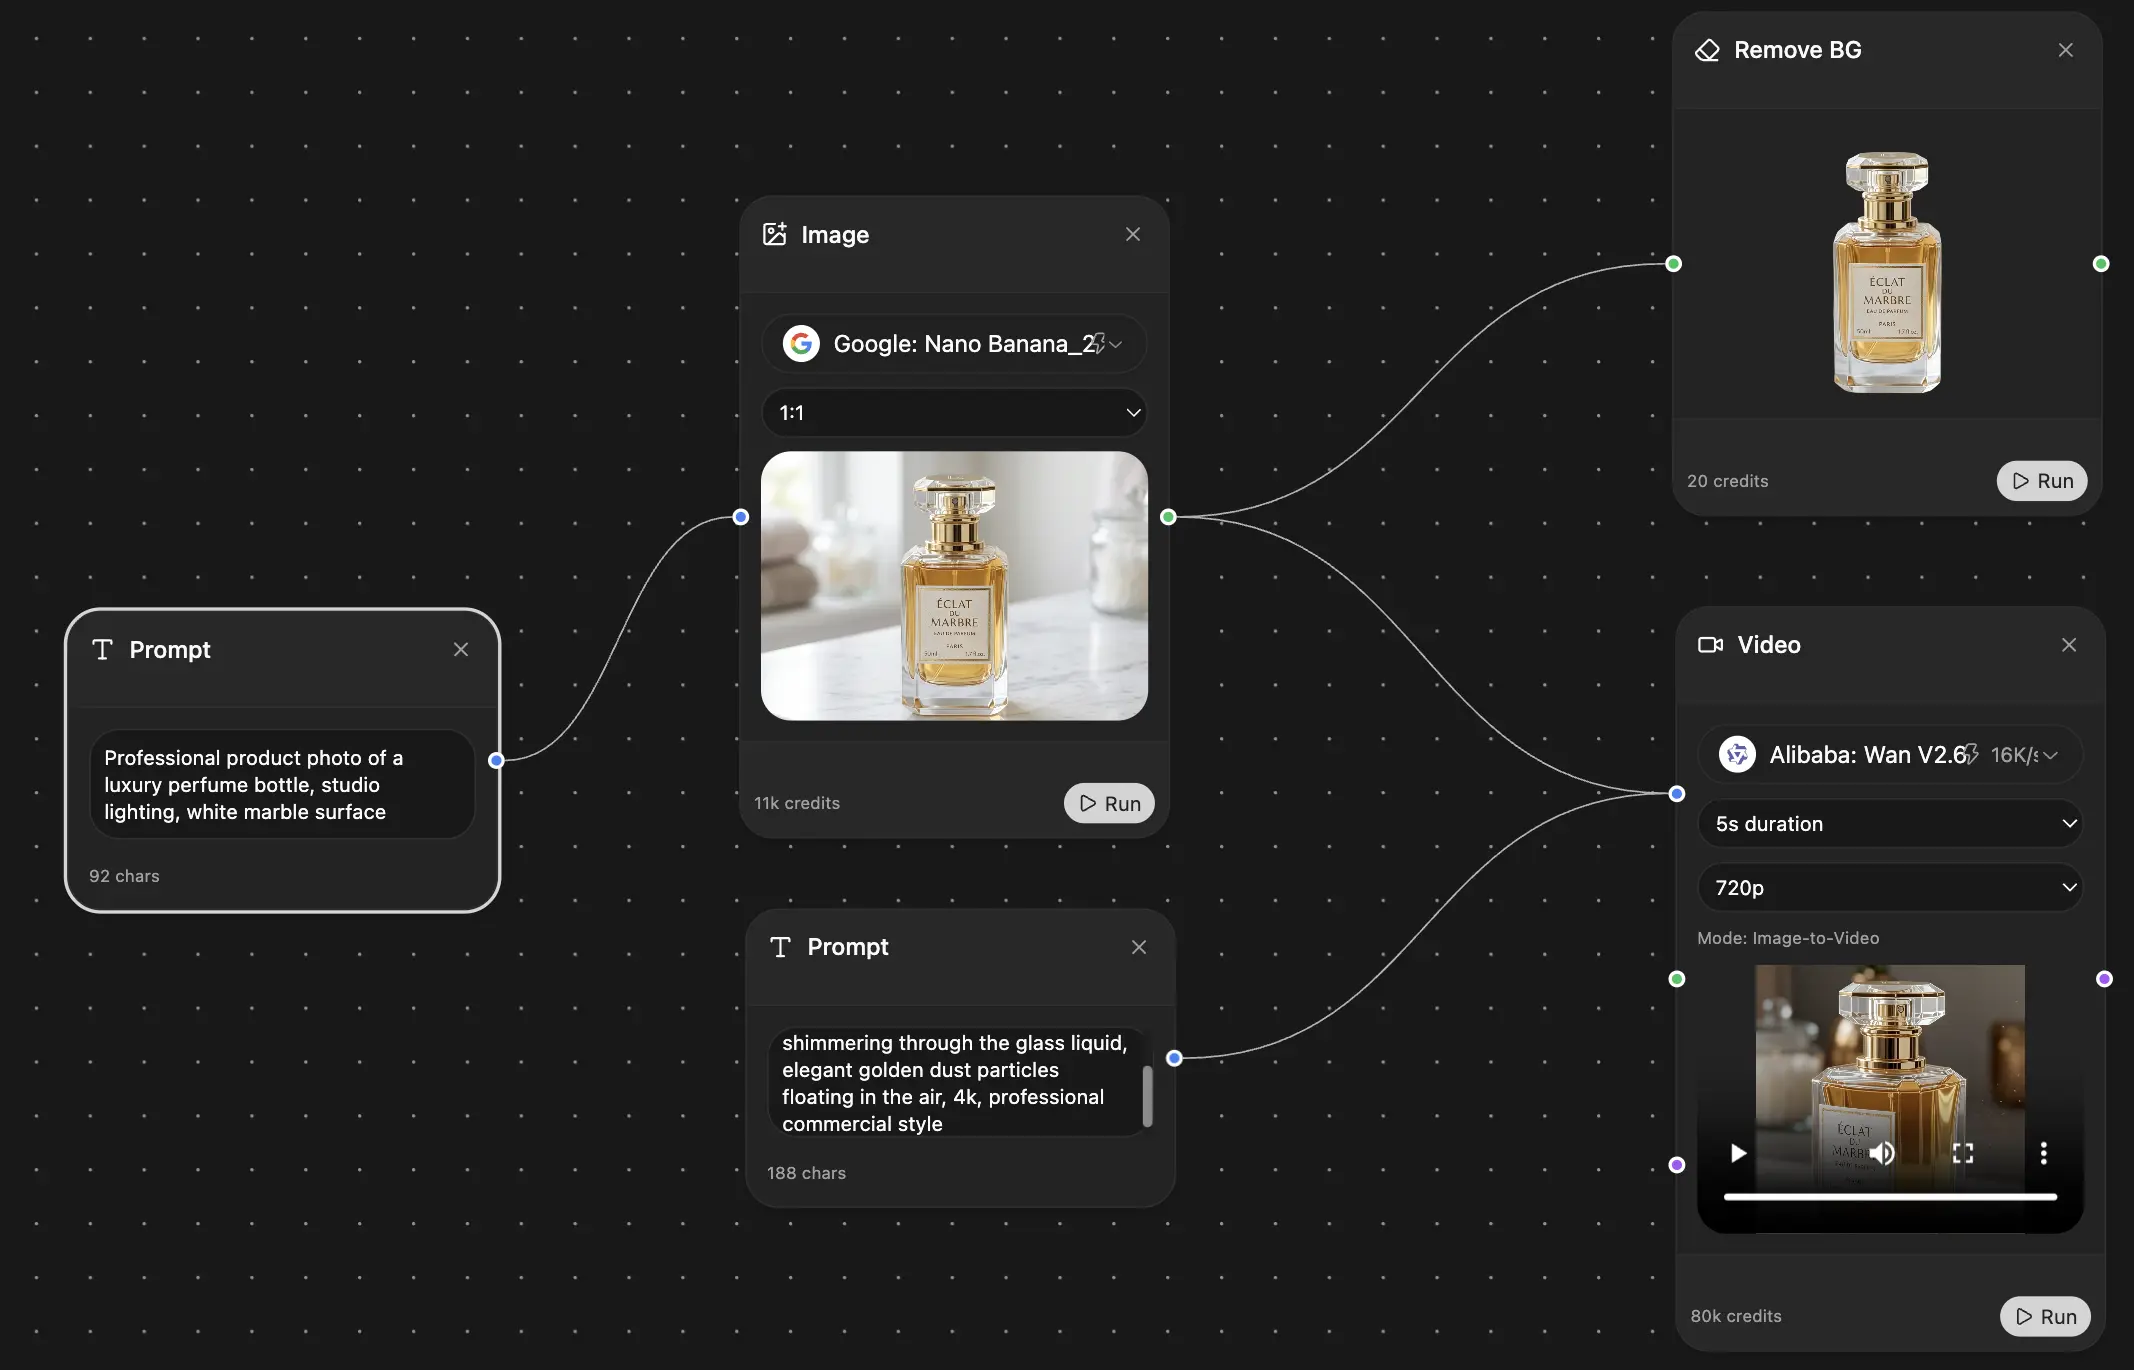
We will also explore how leveraging an integrated AI workspace like Zemith.com can streamline this process. From initial data analysis to generating polished visual concepts, using the right tools helps you implement these best practices with unprecedented efficiency and precision.
1. Choose the Right Chart Type
The foundation of any effective data visualization is selecting the appropriate chart type. This choice isn't merely aesthetic; it's a critical decision that determines how clearly and accurately your audience will understand the data's story. The right chart makes complex information intuitive, while the wrong one can obscure insights or, even worse, mislead. This principle is a cornerstone of data visualization best practices because it directly impacts the interpretability and effectiveness of your communication.

The goal is to match your visualization method to your communication intent. If you want to show a trend over several quarters, a line chart is far more effective than a bar chart. Similarly, if you're comparing sales figures across different product categories, a bar chart provides a much clearer side-by-side comparison than a pie chart.
When to Use This Practice
You should apply this best practice at the very beginning of any visualization project. Before you even start building, ask yourself two key questions:
- What relationship in the data do I want to show? Are you comparing values, showing distribution, analyzing relationships between variables, or illustrating composition?
- Who is my audience and what do they need to understand? A simple bar chart might be perfect for a general executive summary, while a complex scatter plot could be necessary for a technical deep dive.
Actionable Tips for Implementation
To make the right choice every time, follow these guidelines:
- For Comparisons: Use bar charts to compare distinct categories or column charts if you have fewer items.
- For Trends Over Time: Choose line charts to display continuous data over a period. This is ideal for tracking stock prices or monthly web traffic.
- For Parts-of-a-Whole: Apply pie charts or donut charts sparingly, only when showing composition with six or fewer categories. For more complex breakdowns, a stacked bar chart is often clearer.
- For Relationships: Use scatter plots to investigate the relationship between two different variables, revealing correlations or outliers.
2. Simplify and Declutter
Once you've chosen the right chart, the next step is to refine it by removing everything that doesn't add informational value. This principle, often summarized by Edward Tufte's concept of maximizing the "data-ink ratio," involves eliminating visual clutter so the data itself can shine. A cluttered visualization forces the audience to work harder to find the insight, while a clean, focused design presents it with immediate clarity. This is one of the most critical data visualization best practices for creating professional and effective graphics.

Think of the minimalist dashboards seen in Apple's design philosophy or the clean statistical charts from publications like The Economist and FiveThirtyEight. They succeed because every element serves a purpose. By removing extraneous borders, heavy gridlines, and decorative effects, they guide the viewer's attention directly to the most important information. This approach transforms a chart from a simple graphic into a powerful communication tool.
When to Use This Practice
You should apply this principle during the design and review phase of every visualization project. After creating an initial draft, critically assess every element on the page. This practice is especially crucial when preparing visualizations for executive summaries, public reports, or any situation where clarity and speed to insight are paramount. The goal is to make your visualization as easy to interpret as possible, reducing cognitive load for your audience.
Actionable Tips for Implementation
To effectively simplify and declutter your charts, follow these specific guidelines:
- Remove Unnecessary Gridlines and Borders: Heavy gridlines and chart borders rarely add value. Mute them, make them lighter, or remove them completely to let the data stand out.
- Eliminate 3D Effects and Shadows: Avoid 3D effects, shadows, and gradients. These stylistic choices distort data perception and add unnecessary visual noise.
- Use Direct Labeling: Instead of a separate legend that requires viewers to look back and forth, label data series directly on the chart. This makes interpretation faster and more intuitive.
- Limit Your Color Palette: Use color strategically to highlight key data points or differentiate categories. A limited, purposeful color scheme is more effective than a rainbow of distracting hues.
- Question Every Element: For each line, label, and color, ask: "Does this help the user understand the data?" If the answer is no, remove it.
3. Use Color Strategically
Color is one of the most powerful tools in data visualization, but it's also one of the easiest to misuse. Strategic color application goes far beyond simple aesthetics; it serves a functional purpose by guiding the viewer's attention, highlighting key insights, and enhancing overall comprehension. When used thoughtfully, color can instantly communicate meaning, such as using a traffic light system (red, yellow, green) on a KPI dashboard. This principle is a fundamental data visualization best practice because it can make or break the clarity and accessibility of your message.

The goal is to use color with intent, not just for decoration. For example, using a distinct, bright color to draw attention to the most significant data point in a chart helps tell a story quickly. In contrast, using too many colors can create visual noise that distracts and confuses the audience, obscuring the very information you want to convey. By treating color as a strategic element, you can build visualizations that are both beautiful and effective.
When to Use This Practice
You should consider your color strategy during the design phase of any visualization project. Thoughtful color selection is crucial when you need to:
- Highlight specific data points: Use a single, contrasting color to make a key finding stand out from the rest of the data.
- Represent quantitative values: Employ sequential or diverging color palettes to show intensity, such as in a heat map showing website engagement.
- Distinguish between categories: Assign distinct, easily differentiable colors to separate categories in a bar or pie chart.
Actionable Tips for Implementation
To apply color effectively and responsibly in your visualizations, follow these guidelines:
- Ensure Accessibility: Use tools like ColorBrewer to select colorblind-safe palettes. Approximately 8% of men have some form of color vision deficiency, and designing for them is essential.
- Limit Your Palette: Stick to a limited palette of 3-7 distinct colors to avoid overwhelming your audience. For more complex datasets, consider using a single hue with varying shades.
- Use Intuitive Colors: Leverage common color associations, like green for growth or gains and red for losses. However, be mindful of cultural contexts where colors can have different meanings.
- Test in Grayscale: A well-designed visualization should still be understandable without color. Converting your chart to grayscale is a great test of its structural clarity and reliance on color alone.
4. Optimize for Readability
A visually stunning chart is useless if its audience cannot read the labels, understand the axes, or decipher the text. Optimizing for readability ensures that all text and visual elements are clear, legible, and appropriately sized for the intended viewing context. This foundational principle of data visualization best practices involves deliberate choices in typography, sizing, contrast, and layout to prevent user frustration and ensure the data's message is easily consumed.

This practice is deeply rooted in accessibility and user-centered design, championed by organizations like the Web Content Accessibility Guidelines (WCAG) committee and the Nielsen Norman Group. Whether it's a dashboard on a large monitor or an interactive chart on a mobile phone, readability must be a priority, not an afterthought. Making your visualizations accessible expands your audience and enhances the impact of your insights.
When to Use This Practice
Readability should be a constant consideration throughout the entire design process, from initial wireframing to final testing. It's especially critical in these scenarios:
- Multi-Platform Delivery: When your visualization will be viewed on various devices (desktops, tablets, phones), you must ensure it remains legible on the smallest screen.
- Diverse Audiences: If your audience includes individuals with visual impairments or older users, high contrast and larger font sizes are non-negotiable.
Actionable Tips for Implementation
To ensure your visualizations are clear and accessible, follow these guidelines:
- Prioritize Font Size: Use a minimum of 12pt font for body text and labels. For audiences that may include older users or for displays viewed from a distance, increase this to 14pt or larger.
- Ensure High Contrast: Adhere to WCAG recommendations by maintaining a minimum contrast ratio of 4.5:1 for normal text. Avoid common mistakes like light gray text on a white or light-colored background.
- Maintain Typographic Consistency: Use a consistent and legible font family throughout your visualization. The principles of clear writing are just as important as the numbers; you can learn more about .
- Test on Actual Devices: Always test your visualization on the actual devices your audience will use. A design that looks perfect on a large design monitor may be unreadable on a smartphone.
5. Tell a Clear Story
Beyond simply presenting data, the most impactful visualizations guide the audience through a coherent narrative. This practice involves structuring your charts and dashboards to tell a clear, compelling story that builds understanding progressively. By combining data analysis with classic storytelling principles, you can transform a static set of numbers into a memorable and actionable insight that resonates with your audience. This approach is a critical data visualization best practice because it moves beyond mere information delivery to create genuine understanding and persuasion.
The goal is to create a guided journey for your viewer. Think of John Snow’s famous cholera map, which didn't just show data points but told a powerful story identifying a contaminated water pump as the outbreak's source. Similarly, Hans Rosling's Gapminder presentations used animated scatter plots to narrate decades of global development, making complex trends accessible and engaging.
When to Use This Practice
You should apply storytelling principles whenever your goal is to persuade, inform, or drive a specific action. This is especially crucial when presenting complex findings to a non-technical audience or when the data's implications are not immediately obvious. Ask yourself these questions:
- What is the key message I want my audience to take away? Every element in your visualization should serve this core message.
- What context is necessary for this message to make sense? A story needs a beginning (context), a middle (the findings), and an end (the conclusion or call to action).
Actionable Tips for Implementation
To build a powerful narrative with your data, follow these guidelines:
- Start with Context, End with Implications: Begin by setting the scene and explaining the "why." Conclude with a clear takeaway or a recommended next step to make the data actionable.
- Use Annotations to Guide Interpretation: Add text labels, callouts, or arrows to highlight key data points, explain anomalies, or explicitly state the insight you want the viewer to see.
- Sequence Charts for Progressive Understanding: If using multiple visuals, arrange them in a logical order that builds on previous information, much like chapters in a book.
- Balance Detail with Accessibility: Provide enough data to support your story without overwhelming the audience. This is similar to crafting effective technical documentation, which must be both comprehensive and clear. For more on this, you can .
6. Maintain Accurate Scales and Context
One of the most critical data visualization best practices is maintaining the integrity of your data through accurate scales and sufficient context. The way you scale your axes and frame your data can dramatically alter its interpretation. An honest visualization presents data relationships truthfully, without exaggeration or distortion, ensuring that the visual story matches the underlying numbers. This builds trust and prevents the audience from drawing incorrect conclusions.
The goal is to provide a complete and unbiased picture. For example, a bar chart showing revenue figures that starts its Y-axis at $5 million instead of zero will make small differences look like massive gaps. Conversely, showing COVID-19 case counts without adjusting for population size can mislead viewers about which regions are most affected. Accurate representation is the bedrock of ethical and effective data communication.
When to Use This Practice
This best practice should be a non-negotiable standard for every visualization you create. It is especially vital in situations where decisions are being made based on the data, such as financial reporting, scientific analysis, or public policy dashboards. Before finalizing any chart, ask yourself:
- Does the visual accurately represent the magnitude of the data? Are small changes being visually amplified, or are significant shifts being minimized?
- Is there enough context for the audience to understand the data's meaning? Does a standalone number mean anything without a benchmark, target, or historical average?
Actionable Tips for Implementation
To ensure your visualizations are always accurate and contextual, follow these guidelines:
- Start Bar Charts at Zero: The length of a bar is what viewers interpret. Always start the value axis of a bar chart at zero to avoid distorting comparisons. Line charts, which show trends, do not always need to start at zero.
- Provide Contextual Benchmarks: Include relevant data points like industry averages, historical performance, or project targets. Reference lines or annotations can instantly show whether performance is good or bad.
- Use Consistent Scales: When placing charts side-by-side for comparison (e.g., sales by region), use the same scale for each. This allows for fair, at-a-glance comparisons.
- Be Clear About Scale Changes: If you must use a logarithmic scale or a broken axis, make it extremely obvious with clear labels and visual indicators to prevent misinterpretation.
7. Design for Your Audience
A technically perfect visualization can still fail if it doesn't resonate with its intended audience. Designing for your audience means tailoring the complexity, language, and overall design of your visualization to meet the specific needs, context, and expertise of the people who will be using it. This user-centered approach is a fundamental data visualization best practice that transforms a chart from a simple data display into a powerful communication tool.
The core principle is that effectiveness is relative. A dashboard for a CEO should highlight high-level KPIs and trends for quick strategic decisions, while a visualization for a data science team should include granular details, statistical summaries, and interactive filters for deep exploration. Ignoring the user's context is like speaking a language they don't understand; the message is lost, no matter how eloquent.
When to Use This Practice
This practice should be a constant consideration throughout the entire design process, from initial concept to final delivery. It is most critical during the planning and prototyping phases. Before creating any visualization, you must have clear answers to these questions:
- Who is the primary audience? Are they executives, analysts, customers, or the general public?
- What is their level of data literacy? Can they interpret a box plot, or should you stick to more universally understood charts like bar and line graphs?
- What is their goal? What specific questions are they trying to answer or what decision are they trying to make with this data?
Actionable Tips for Implementation
To ensure your visualizations are always audience-appropriate, follow these guidelines:
- Adjust Complexity: Simplify dashboards for executive or public audiences by focusing on key insights. For expert users, provide layers of detail and advanced analytical features.
- Consider the Context: A visualization designed for a large presentation screen will be ineffective on a mobile device. Design responsively and prioritize information based on the viewing environment.
- Test with Real Users: Create prototypes and gather feedback from a small group of representative users. Their input is invaluable for identifying points of confusion or missed opportunities.
- Use Familiar Language: Avoid technical jargon when communicating with a non-technical audience. Effective visualizations often become key assets in an organization's knowledge base. To manage and share these insights efficiently, you can explore more about centralizing information with .
8. Enable Interactivity When Appropriate
Moving beyond static images, interactive visualizations transform the user from a passive observer into an active explorer. Incorporating interactive elements like filters, tooltips, and drill-downs allows your audience to engage with the data on their own terms, asking and answering their own questions. This practice is a powerful component of modern data visualization best practices because it caters to individual curiosity and enables a deeper, more personalized understanding of complex datasets.
The key is to add interactivity with a clear purpose, not just for the sake of it. A well-designed interactive dashboard, like those seen on Tableau Public or in Google Analytics, guides users toward insights rather than overwhelming them with options. The goal is to enhance comprehension by allowing users to slice, dice, and view the data from multiple perspectives, turning a single chart into a dynamic exploratory tool.
When to Use This Practice
Interactivity is most effective when you are presenting a complex or multi-faceted dataset to a diverse audience. Consider adding interactive features in these scenarios:
- When you have layered data: If your dataset contains multiple levels of granularity, such as national, state, and city-level sales data, interactivity allows users to drill down to their area of interest.
- When the audience has varied needs: An interactive dashboard can serve both a high-level executive looking for a summary and an analyst who needs to dig into the details.
Actionable Tips for Implementation
To implement interactivity effectively, focus on user experience and analytical goals:
- Start with a Goal: Design interactions that directly support specific analysis tasks. For example, use filters to help users compare performance between different product categories.
- Provide Clear Feedback: Ensure that every user action, like clicking a button or hovering over a data point, results in immediate and obvious visual feedback.
- Follow UI Conventions: Use familiar patterns like drop-down menus for filtering and tooltips for details-on-demand. This reduces the learning curve for your audience.
- Test with Real Users: Before launching, have actual users interact with your visualization to identify any points of confusion or usability issues. This ensures the experience is intuitive.
Best Practices Comparison of 8 Key Data Viz Strategies
Empowering Your Insights with Smarter Tools
The journey from raw data to compelling insight is both an art and a science. As we've explored, mastering data visualization best practices is not about memorizing rigid rules but about developing an intuitive understanding of how to communicate information clearly, ethically, and effectively. From selecting the perfect chart type to weaving a narrative that resonates, each principle serves a single, powerful purpose: to transform complexity into clarity.
By consistently applying these techniques, you move beyond creating mere illustrations of data. You start crafting analytical tools that empower decision-making. A well-designed visualization doesn't just present numbers; it reveals patterns, highlights opportunities, and exposes risks that would otherwise remain hidden within spreadsheets and databases. The core takeaways from our exploration are to always prioritize your audience, simplify ruthlessly, and maintain unwavering accuracy. These are the cornerstones of impactful data communication.
From Principles to Practice
Adhering to these data visualization best practices ensures your work is not only seen but understood. The real value emerges when your audience can quickly grasp the key message without needing a manual. This is where the strategic use of color, thoughtful decluttering, and a focus on readability pay significant dividends. Your goal is to shorten the distance between data and decision.
To put these concepts into action, start with your next project:
- Audit Your Next Chart: Before you publish, review it against the principles discussed. Is the scale accurate? Is every visual element serving a purpose?
- Seek Peer Feedback: Ask a colleague who is unfamiliar with the data what their main takeaway is. If their answer doesn't align with your intended message, it’s a sign to refine your visualization.
- Embrace Iteration: Your first draft is rarely your best. Experiment with different chart types, color palettes, and layouts to find the most effective combination for your specific story.
Mastering these skills elevates your professional toolkit, enabling you to build more persuasive arguments, deliver more impactful presentations, and contribute more strategically to your organization's goals. But principles alone are only half of the equation; the right tools can act as a significant force multiplier.
Imagine streamlining this entire process with an intelligent partner. A platform like Zemith can revolutionize how you work with data. You could use its Document Assistant to instantly suggest optimal chart types for your dataset or leverage the Smart Notepad to draft your narrative and annotations in one seamless workflow. Zemith’s integrated suite of AI-powered tools is designed to handle the technical overhead, freeing you to concentrate on what truly matters: uncovering and communicating the powerful stories hidden within your data.
Ready to transform your data into a strategic asset? Discover how the AI-powered suite of tools from Zemith can streamline your workflow, from initial analysis to final presentation. Visit to see how you can apply these best practices faster and more effectively than ever before.
Explore Zemith Features
Every top AI. One subscription.
ChatGPT, Claude, Gemini, DeepSeek, Grok & 25+ more


Always on, real-time AI.
Voice + screen share · instant answers
What's the best way to learn a new language?
Immersion and spaced repetition work best. Try consuming media in your target language daily.
Voice + screen share · AI answers in real time
Image Generation
Flux, Nano Banana, Ideogram, Recraft + more

Write at the speed of thought.
AI autocomplete, rewrite & expand on command
Any document. Any format.
PDF, URL, or YouTube → chat, quiz, podcast & more
Video Creation
Veo, Kling, Grok Imagine and more

Text to Speech
Natural AI voices, 30+ languages
Code Generation
Write, debug & explain code
Chat with Documents
Upload PDFs, analyze content
Your AI, in your pocket.
Full access on iOS & Android · synced everywhere
Your infinite AI canvas.
Chat, image, video & motion tools — side by side
Save hours of work and research
Transparent, High-Value Pricing
Trusted by teams at
Free
No credit card required
- 100 credits daily
- 3 AI models to try
- Basic AI chat
Plus
- 1,000,000 credits/month
- 25+ AI models — GPT, Claude, Gemini, Grok & more
- Agent Mode with web search, computer tools and more
- Creative Studio: image generation and video generation
- Project Library: chat with document, website and youtube, podcast generation, flashcards, reports and more
- Workflow Studio and FocusOS
Professional
- Everything in Plus, and:
- 2,100,000 credits/month
- Pro-exclusive models (Claude Opus, Grok 4, Sonar Pro)
- Motion Tools & Max Mode
- First access to latest features
- Access to additional offers
What Our Users Say
Great Tool after 2 months usage
"I love the way multiple tools they integrated in one platform. Going in the right direction."
— simplyzubair
Best in Kind!
"The quality of data and sheer speed of responses is outstanding. I use this app every day."
— barefootmedicine
Simply awesome
"The credit system is fair, models are perfect, and the discord is very responsive. Quite awesome."
— MarianZ
Great for Document Analysis
"Just works. Simple to use and great for working with documents. Money well spent."
— yerch82
Great AI site with accessible LLMs
"The organization of features is better than all the other sites — even better than ChatGPT."
— sumore
Excellent Tool
"It lives up to the all-in-one claim. All the necessary functions with a well-designed, easy UI."
— AlphaLeaf
Well-rounded platform with solid LLMs
"The team clearly puts their heart and soul into this platform. Really solid extra functionality."
— SlothMachine
Best AI tool I've ever used
"Updates made almost daily, feedback is incredibly fast. Just look at the changelogs — consistency."
— reu0691