How to Analyze Market Trends: A Practical Guide for Growth
Learn how to analyze market trends and turn insights into real business growth with practical tools and data-driven steps.
Ever feel like your business strategy is just spaghetti thrown at a wall, hoping something sticks? You're not alone. The good news is, you don’t need a crystal ball to make smarter decisions. Knowing is the closest thing you’ll get, and it's less about wizardry and more about being a good detective.
It’s less about memorizing complex formulas and more about learning to spot the ‘why’ behind what your customers and competitors are doing. It really boils down to a simple, repeatable framework: set a clear goal, gather the right data, and turn what you find into a real-world business strategy.
This whole process is about moving from observation to decision-making with a clear purpose. It's how you turn confusing market signals into a real advantage.
Define Your Mission First
Before you dive headfirst into a sea of spreadsheets, stop and ask: what are you actually trying to figure out? Are you wondering why a certain product is suddenly flying off the shelves? Or maybe you're trying to nail down where a competitor consistently outmaneuvers you.
Defining your mission from the get-go helps you avoid the dreaded 'analysis paralysis'—that feeling of drowning in data but being starved for actual wisdom. Trust me, it's a real thing, and it's where good intentions go to die.
This simple process flow sums it up perfectly. It’s all about connecting your goal to a final action.
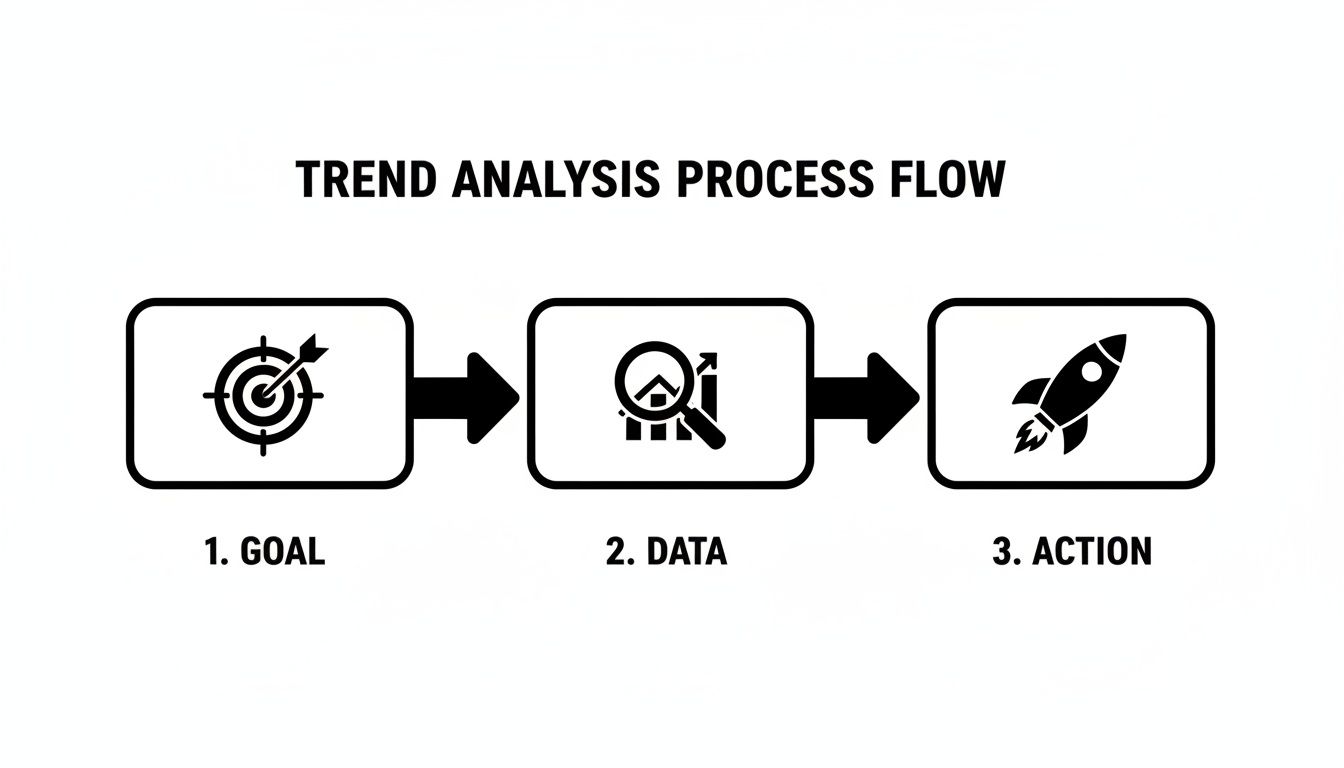
This visual drives home a key point: analysis isn't just about collecting data. It's a direct line from a specific objective to a decisive action. Without a starting goal and an ending action, data collection is just an expensive hobby.
To get you started, here’s a quick-glance table breaking down the core components you’ll need.
Your Market Trend Analysis Starter Kit
This table provides a simple roadmap for turning confusing information into your next big win.
Key Takeaway: True trend analysis isn't a passive research project. It’s an active process of inquiry and response that directly fuels your business strategy and promotes .
This whole workflow gets a lot easier when you have a smart assistant to do some of the heavy lifting.
With a platform like Zemith, for instance, you can pull this entire process into one place. Use its Deep Research feature to gather competitor data, chat with the Document Assistant to get quick summaries of dense industry reports, and then use the Smart Notepad to brainstorm your next steps—all without jumping between a dozen different apps. It’s like having an entire research department at your fingertips.
Hunting for Gold in a Mountain of Data
To get a real handle on market trends, you need data. A lot of it. But let's be honest, most of what's out there is just noise—a giant mountain of numbers and opinions that don’t mean much on their own. Your job is to be a treasure hunter, sifting through all that noise to find the nuggets of gold.
This treasure hunt starts with knowing exactly what you’re looking for. Generally, data falls into two main camps, and you absolutely need both to get the full picture.
The What vs. The Why
First up, you've got quantitative data. This is the hard stuff, the numbers that tell you what is happening. Think sales figures, website traffic, conversion rates, and market share percentages. It’s measurable, objective, and perfect for spotting patterns from a 30,000-foot view.
Then there’s qualitative data. This is the softer, more nuanced info that tells you why things are happening. It’s the real story, hidden in customer reviews, social media comments, open-ended survey responses, and forum discussions. This data gives you the context and the human element behind the numbers.
A spike in sales (quantitative) is interesting, sure. But knowing it came right after customers started raving about your new packaging on Instagram (qualitative)—that’s a game-changing insight. One tells you the score, the other tells you how the game was won.
Where to Find Your Data Gold
You don't need a massive budget to start collecting valuable information. Some of the best sources are completely free and hiding in plain sight. To really 'hunt for gold' in market data, you need a solid grasp of effective methods. For more advanced strategies, this guide on proven is a great place to level up.
Here are a few of my go-to spots:
- Google Trends: An absolute gem for tracking interest in a topic over time. You can compare search terms, see where interest is coming from geographically, and spot rising trends before they hit the mainstream. Pro tip: look for "breakout" keywords to find topics about to explode.
- Industry Reports & Publications: Check out trade journals or market research firms in your niche. Many publish free reports or summaries that are packed with valuable stats.
- Public Datasets: Government websites (like the Census Bureau or the Bureau of Labor Statistics) are treasure troves of demographic and economic data just waiting to be explored.
Here's a quick example from Google Trends showing search interest for "AI assistant" over the past year.
The chart clearly shows a steady upward climb. This tells you that consumer interest in this tech isn't just a fad; it's a sustained and growing market trend.
Of course, collecting data is just the first step. You still need to make sense of it all. For a deeper look, check out our guide on for some practical tips. But what if you could speed up the whole process?
Pro Tip: Don't get lost in messy spreadsheets. The real challenge isn't just finding data; it's cleaning it up so it tells a clear story. Always take the time to remove duplicates, fix formatting errors, and standardize your information before you dive into analysis.
This is where an AI powerhouse like Zemith becomes your secret weapon. Instead of spending hours slogging through a dense, 50-page industry report, you can use its Document Assistant to get the key takeaways in seconds. Even better, its Deep Research feature can pull in real-time web data and fact-check it instantly, saving you from tedious work so you can focus on what matters: finding that gold.
Picking the Right Tools for the Job
Alright, you've got your data collected and cleaned up. Now for the fun part: actually figuring out what it all means. This is where you put on your detective hat and choose the right techniques to slice and dice the information. Don't let the technical names fool you; these are just different ways to look at your data to uncover the story it's telling.

The trick is to match your method to your mission. You wouldn't use a microscope to look at the stars, right? Same idea here. The analysis technique you pick depends entirely on the questions you're trying to answer and the kind of data you’ve gathered.
Your Go-To Analysis Techniques
Let's walk through a few of the most common and effective methods. Think of these as different lenses for your investigation, each one designed to bring specific details into focus.
Time Series Analysis: This is your crystal ball for seeing patterns over time. It’s perfect for answering questions like, "Do our sales always dip in February?" or "Is our web traffic steadily climbing?" It's all about identifying seasonality, long-term growth, and any other repeating cycles.
Competitor Analysis: Time to do some good old-fashioned recon. This is where you dig into what your rivals are doing—their pricing models, their latest marketing blitz, what customers love (and hate) about their products. The goal is to spot a gap they've overlooked that you can swoop in and own.
Sentiment Analysis: This one is a game-changer for understanding your audience. By scanning customer reviews, social media comments, and even support tickets, you can get a real pulse on how people feel about you. Is the chatter overwhelmingly positive, or is there a wave of frustration you need to get ahead of? It's like listening in on thousands of conversations at once.
One classic technique here is using moving averages to smooth out noisy data and see the real direction things are heading. For example, in financial markets, certain moving average signals have historically preceded market gains of 14.2% over the following year. Modern AI tools can spot these kinds of patterns in real-time across huge datasets, giving you a serious edge.
Keeping Your Workflow in One Place
Hopping between a dozen different apps—one for charts, another for social listening, a third for writing notes—is a surefire way to lose your mind and miss crucial connections. It's inefficient and makes it nearly impossible to see the bigger picture.
My Two Cents: The best insights come from seeing how different data points connect. When your tools are all in one place, you stop wasting time switching tabs and start finding those "aha!" moments.
This is why an all-in-one platform is so valuable. For instance, with a tool like Zemith, you can pull competitor reports, run sentiment analysis on customer interviews, and then map out your entire strategy in its Smart Notepad—all in a single workspace. It helps you connect the dots between what the market is saying and what you should do next.
If you're looking for more ways to consolidate your toolkit, check out our roundup of the .
Telling a Story with Your Data
Let's be brutally honest for a second. A spreadsheet packed with raw numbers is a fantastic cure for insomnia, but it’s terrible for inspiring action. If you want your findings to actually matter to your team, you have to turn that data into a story people can understand in a single glance.
This is where the magic of data visualization comes in. It’s all about translating complex analysis into clear, persuasive visuals that scream, "Pay attention to this!" A great chart can communicate in five seconds what a five-page report struggles to explain.
Your mission is to build reports and dashboards where the key trends jump right off the page. The main takeaway should be instantly obvious, even to the busiest executive. You don't need a degree in graphic design to pull this off, just a solid grasp of a few core principles.
Making Data Beautiful and Persuasive
The first rule? Avoid "chart junk"—any unnecessary visual clutter that distracts from the core message. Keep it simple and focused. Every single chart should answer one specific question clearly.
Here are a few classic ways to visualize different types of trend data:
- Line Charts: These are your best friends for showing change over time. Think website traffic growth, monthly sales figures, or social media follower counts. The upward or downward slope tells an immediate story.
- Bar Charts: Perfect for comparing different categories. Use them to show which marketing channel drives the most leads or which product is your top seller.
- Heat Maps: Want to see geographic hot spots? Heat maps are brilliant for showing where your customers are concentrated, helping you target regional marketing campaigns with precision.
Ultimately, the goal is to present your analysis in a way that’s ridiculously easy to digest. A well-designed visual isn't just a pretty picture; it's an argument. It guides your audience to the same conclusion you reached, making your recommendations feel inevitable.
For more tips on crafting compelling reports, our guide on effective offers some great starting points.
Key Takeaway: The goal of visualization isn't to show data; it's to communicate insight. A chart succeeds when someone can look at it and immediately grasp the main point without needing a lengthy explanation.
This process of turning numbers into a compelling narrative is a huge part of analyzing market trends effectively. And the right tools can make it a creative, even enjoyable, process. An integrated platform like Zemith lets you keep everything in one spot. You can brainstorm chart layouts with your team on the Whiteboard and then use the image tools to create custom, on-brand graphics for your presentation that make everyone sit up and pay attention.
Turning Your Insights Into Action
Okay, so you've done the heavy lifting. You've gathered the data, wrestled with the analysis, and created some visualizations that would make your high school math teacher proud. Now what?
This is the part that really matters. All the analysis in the world is just a fun intellectual exercise if it ends up in a forgotten PowerPoint deck. The real goal is to turn those lightbulb moments into actual business moves.

Ultimately, analyzing market trends is all about making smarter, faster decisions. It’s about creating a simple “if this, then that” path forward. If you spot a growing appetite for eco-friendly products, that’s your signal to start exploring a sustainable product line. It really can be that direct.
From Insight to Initiative
Don't let your hard-earned momentum fizzle out after the final presentation. Each key insight you uncover should be the starting gun for a new project or experiment.
Let's say you notice a major competitor is getting hammered in online reviews for their terrible customer service. That’s more than just an interesting tidbit of data—it’s a golden opportunity. That's your cue to launch a marketing campaign highlighting your own stellar support and scoop up their frustrated customers. To get a better handle on this, check out our guide on building a .
The trick is to shift from just observing to actively brainstorming. Get the right people together and start asking pointed questions based on what you’ve learned.
- What’s the biggest opportunity this data is screaming at us?
- What's the most pressing threat we need to get ahead of, right now?
- Based on this, what’s one small thing we can test next week?
This approach breaks down a potentially overwhelming report into a clear set of next steps. You’re building a feedback loop: act on what you learned, measure what happens, and do it all over again.
Building a System for Action
To keep your insights from getting buried under the daily grind, you need a system. This isn't about creating one massive, perfect plan. It's about building a repeatable habit of acting on what you know.
Key Takeaway: An insight without a clear next step is just trivia. The true power of trend analysis is building a process that consistently turns findings into prioritized projects that actually move the needle.
This is where having everything in one place can make a huge difference. Instead of letting your insights get scattered across different apps and documents, you can bring the whole workflow under one roof.
Inside a tool like Zemith, for instance, you can take your final analysis and immediately kick off a new initiative in the Projects feature. You can use the AI chat to brainstorm campaign angles, feeding it your original research for context. You could even use the Coding Assistant to help mock up a new landing page to test your idea.
It closes the loop. It connects the "what" (the trend) with the "how" (the project) without missing a beat. This is how you ensure that every ounce of effort you put into analysis leads to real, tangible progress.
Common Questions About Market Trend Analysis

Still have some questions buzzing around? We totally get it. Learning how to analyze market trends is a process, and a few things always pop up. Here are some of the most common queries we see from people just getting started.
How Often Should I Be Doing This?
Honestly, there’s no magic number—it really depends on how fast your industry moves.
For dynamic fields like tech or fashion where things can change on a dime, I’d recommend a deep dive every quarter with quick monthly check-ins. It's a smart rhythm to stay ahead. But for more stable industries, doing a thorough analysis every six months might be plenty.
The most important thing is consistency. Block it out on your calendar and treat it like a recurring meeting with the future of your business. That way, you’re always looking ahead instead of just reacting.
What Is the Biggest Mistake People Make?
The classic blunder is “analysis paralysis”—getting so buried in data that you never actually make a decision. It’s a real thing, and it can stop your strategy dead in its tracks. You collect one more report, run one more query, and before you know it, the opportunity is gone.
Another big one is confirmation bias. This is where you subconsciously only look for data that proves what you already believe. It's human nature, but it's terrible for business.
To dodge these traps, start every analysis with a clear question, give yourself a firm deadline for the research phase, and be genuinely open to what the data tells you—even if it's not what you wanted to hear.
Can I Do This With a Small Budget?
Absolutely! You don't need a six-figure software budget to get powerful insights. Many businesses mistakenly think analyzing market trends requires expensive tools, but that's a myth. There are so many fantastic free resources out there if you know where to look.
Here are a few budget-friendly goldmines:
- : See what the world is searching for, completely free.
- Government Statistics: Census data and economic reports are packed with useful info.
- Social Media: Just listening to conversations in your niche is a powerful form of qualitative data collection.
The trick is to be resourceful. This is also where a platform like provides a ton of value. It packs a researcher, writer, and data analyst into one affordable subscription, saving you from having to pay for multiple specialized tools.
How Does AI Actually Make This Easier?
Think of AI as a super-smart intern who works 24/7 and never needs a coffee break. It’s an insane force multiplier for your brain, handling the tedious work so you have more time to be the brilliant strategist.
Instead of spending an entire afternoon reading a 100-page industry report, an AI can give you a bulleted summary of the most important insights in about 30 seconds. It can scan thousands of customer reviews to find common themes you might miss. It can even help you generate charts or write code to scrape data from the web.
AI doesn't replace your strategic thinking; it just clears your schedule so you can do more of it.
Ready to stop guessing and start making data-driven decisions? The entire workflow we've discussed—from deep research and document analysis to brainstorming on a whiteboard and managing projects—can all be done in one place. With Zemith, you can consolidate your tools, streamline your analysis, and turn insights into action faster than ever.
Explore Zemith Features
Every top AI. One subscription.
ChatGPT, Claude, Gemini, DeepSeek, Grok & 25+ more


Always on, real-time AI.
Voice + screen share · instant answers
What's the best way to learn a new language?
Immersion and spaced repetition work best. Try consuming media in your target language daily.
Voice + screen share · AI answers in real time
Image Generation
Flux, Nano Banana, Ideogram, Recraft + more

Write at the speed of thought.
AI autocomplete, rewrite & expand on command
Any document. Any format.
PDF, URL, or YouTube → chat, quiz, podcast & more
Video Creation
Veo, Kling, Grok Imagine and more

Text to Speech
Natural AI voices, 30+ languages
Code Generation
Write, debug & explain code
Chat with Documents
Upload PDFs, analyze content
Your AI, in your pocket.
Full access on iOS & Android · synced everywhere
Your infinite AI canvas.
Chat, image, video & motion tools — side by side
Save hours of work and research
Transparent, High-Value Pricing
Trusted by teams at
Free
No credit card required
- 100 credits daily
- 3 AI models to try
- Basic AI chat
Plus
- 1,000,000 credits/month
- 25+ AI models — GPT, Claude, Gemini, Grok & more
- Agent Mode with web search, computer tools and more
- Creative Studio: image generation and video generation
- Project Library: chat with document, website and youtube, podcast generation, flashcards, reports and more
- Workflow Studio and FocusOS
Professional
- Everything in Plus, and:
- 2,100,000 credits/month
- Pro-exclusive models (Claude Opus, Grok 4, Sonar Pro)
- Motion Tools & Max Mode
- First access to latest features
- Access to additional offers
What Our Users Say
Great Tool after 2 months usage
"I love the way multiple tools they integrated in one platform. Going in the right direction."
— simplyzubair
Best in Kind!
"The quality of data and sheer speed of responses is outstanding. I use this app every day."
— barefootmedicine
Simply awesome
"The credit system is fair, models are perfect, and the discord is very responsive. Quite awesome."
— MarianZ
Great for Document Analysis
"Just works. Simple to use and great for working with documents. Money well spent."
— yerch82
Great AI site with accessible LLMs
"The organization of features is better than all the other sites — even better than ChatGPT."
— sumore
Excellent Tool
"It lives up to the all-in-one claim. All the necessary functions with a well-designed, easy UI."
— AlphaLeaf
Well-rounded platform with solid LLMs
"The team clearly puts their heart and soul into this platform. Really solid extra functionality."
— SlothMachine
Best AI tool I've ever used
"Updates made almost daily, feedback is incredibly fast. Just look at the changelogs — consistency."
— reu0691