


Every top model, with tools built in.
Search the web, run deep research, read files, create images and run code with GPT, Claude, Gemini, Grok and more.
Learn how to debug HTML code with practical examples, DevTools tips, and Zemith's Coding Assistant. Fix common errors fast.
You've changed one <div>, refreshed the page, and somehow the footer is now inside the navigation. The editor shows tidy indentation. The browser shows a layout that looks like it lost an argument with gravity. A form refuses to submit, a button disappears on mobile, and the console is offering warnings in a dialect you didn't know existed.
That's the frustrating part of learning how to debug HTML code. The file you wrote, the markup the browser received, and the DOM the browser constructed aren't always the same thing. Add CSS, JavaScript, a framework renderer, and accessibility requirements, and “find the missing tag” becomes a much bigger investigation.
The reliable approach is to stop guessing. Reproduce the defect, inspect what the browser built, identify whether HTML, CSS, JavaScript, or accessibility is responsible, then make the smallest fix that proves the diagnosis. Along the way, a tool such as Zemith's Coding Assistant can help turn a vague error into a concrete explanation and a testable next step.
The classic debugging nightmare starts innocently. You open a landing page, notice that the call-to-action button is misaligned, and edit the nearest container. The button moves, but now the form label is detached from its input. You fix that, and a card vanishes on a narrow viewport. After enough refreshes, you're no longer debugging HTML. You're performing ritual maintenance and hoping the browser accepts your offering.
The browser may also be helping you in a way that hides the original mistake. Modern HTML defines parsing and recovery behavior, so malformed markup can still produce a page that looks mostly fine. A missing closing tag or invalid nesting can cause the parser to construct a different tree from the source you intended. Your editor's indentation is a clue, not evidence.
Practical rule: Debug the document the browser built, not only the file you typed.
HTML debugging is a conformance check. You compare markup with the formal rules of the HTML standard, while accounting for the standard and browser behavior that apply today. HTML has passed through major specification changes, from HTML 2.0 and HTML 4.01 to XHTML, HTML5, and the continuously updated standard maintained through W3C and WHATWG collaboration. Older rules can mislead you, especially if you're applying XHTML habits to current HTML. The HTML standards history and conformance guidance explains why current validators and browser tools matter more than assumptions inherited from old projects.
The problem is widespread enough to justify a systematic workflow. Rocket Validator reports that developers worldwide have identified 481 million HTML issues across 13 million checked web pages, averaging about 37 issues per page. That figure describes pages scanned by the service, not every website on the internet, but it makes one point clearly: markup defects aren't rare edge cases. They're normal engineering work. You can also use Zemith's practical code debugging guide when you need a broader method for isolating failures across languages.
Before rewriting markup, create a small investigation. The fastest way to debug HTML is to reduce the number of things that can change between one test and the next.
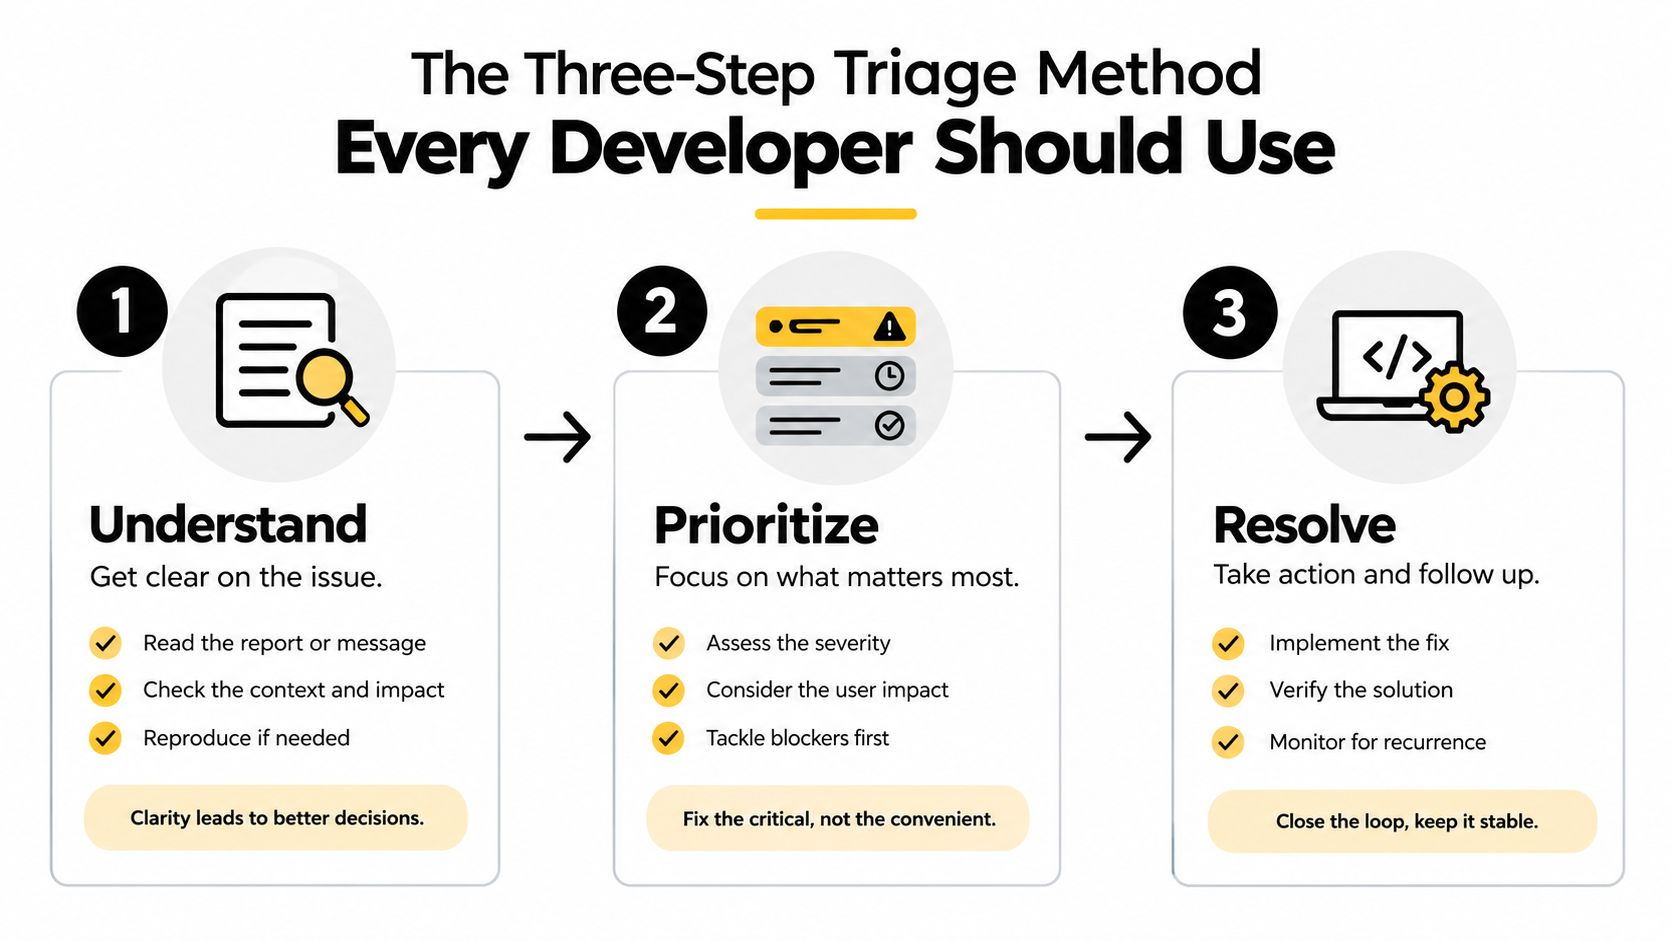
Start with the exact action that triggers the problem. Record the URL or route, viewport size, input values, click sequence, and whether JavaScript is enabled. If the issue appears only after a request completes or only on a mobile breakpoint, write that down. “The page breaks sometimes” isn't a test case. “Open the checkout route, select a shipping option, submit an empty postal-code field, then inspect the form” is.
If possible, copy the relevant markup into a minimal page. Remove unrelated components, third-party scripts, and styles until the defect either disappears or remains. This tells you whether you're dealing with a local HTML problem or an interaction between several systems.
For teams building a wider regression process, Cleffex test automation strategies can help connect an isolated browser defect to repeatable software testing practices. The important principle is simple: a fix that can't be reproduced can't be trusted.
Open DevTools and select the Elements or Inspector panel. Expand the affected element's ancestors and descendants. Check the actual nesting, attributes, text nodes, and generated elements. Look for a node that has moved, disappeared, gained an unexpected class, or received an attribute you never wrote.
Then inspect the Computed styles. A button that “isn't HTML” may have display: none, zero dimensions, clipped overflow, a stacking-context problem, or a flex rule inherited from a parent. The DOM tells you what exists. Computed styles help explain why users can't see or interact with it.
This distinction is central to MDN's HTML debugging guidance: HTML debugging requires separating source markup from the runtime DOM, using browser DevTools to inspect nodes, compare structure, and identify JavaScript modifications before editing source files.
Use the Network panel to inspect the delivered HTML response, then compare it with the live DOM. The response shows what the server sent. The Elements panel shows the active tree after parsing corrections and script changes. If they differ, ask which transition caused the difference.
Disable JavaScript temporarily and reload. If the structure becomes correct, a script or framework render is changing it. If the issue remains, inspect parsing, CSS, the server response, or the asset requests. You can also edit the live DOM directly as a hypothesis test. If moving a node fixes the visual issue, that doesn't fix your source, but it tells you what kind of change to investigate. Zemith's guide to diagnosing faulty code is useful when you need to turn that observation into a clear cause and minimal correction.
Some HTML errors deserve more respect than the dismissive label “just syntax.” A malformed tree can affect layout, form behavior, selectors, anchors, and assistive technology. Start with structure before you polish CSS.

This markup looks plausible at a glance:
The closing order is wrong. The div opens inside the section, so it should close before the section. A browser may repair the structure, but the repaired tree might not match your intended layout or selector relationships. Check the Elements panel rather than trusting indentation, and fix the earliest validator error first. One malformed opening tag or quote can make later errors misleading.
IDs should identify one element. Reusing id="email" across several inputs can break label associations, fragment links, JavaScript selectors, and automated tests. A repeated attribute can also leave the browser with a result that doesn't match what you meant to declare.
WCAG parsing guidance identifies four structural conditions to check: complete start and end tags, proper nesting, no duplicate attributes, and unique IDs unless the specification permits an exception. The W3C parsing guidance connects these issues to accessibility problems, including incorrect roles, states, and accessible names.
A validator can flag conformance failures, but it won't tell you whether a valid page feels confusing on a keyboard or whether a CSS rule hides the content. Validation is a filter, not a final verdict. If your page needs images and you're unsure how to place them without damaging the structure, this HTML image insertion tutorial offers a focused reference. For generated markup, Zemith's HTML code generation workflow can help you review structure before it spreads through a larger page.
A quick emergency check:
If you want a visual walkthrough of the debugging mindset, use the following as a companion while testing your own markup.
A missing element isn't automatically an HTML defect. If the node exists in the live DOM, HTML has probably done its job. The next suspects are CSS rules, script mutations, asset failures, and framework rendering.
Start with a three-way isolation test. Inspect the element in Elements, check the Computed panel, and review the Console. If the node exists but has display: none, visibility: hidden, zero size, clipping, or an unexpected position, follow the applied style back to its stylesheet and selector. If the node disappears entirely, look for script activity and runtime errors.
Chrome DevTools provides DOM change breakpoints. Select the affected element in the Elements panel, right-click it, choose Break on, then choose the breakpoint that matches the symptom:
Chrome pauses execution at the responsible code, including the call stack that led to the mutation. That's much more useful than scattering console.log() statements across a large application and hoping one of them fires at the right moment. The Chrome DevTools breakpoint documentation confirms that these breakpoints reveal which script changed the element.
For framework-rendered interfaces, compare the template or component output with the live DOM. A React, Vue, or server-rendered component can produce valid-looking source while a later render changes attributes, replaces children, or removes nodes. Disable JavaScript as a control test, then re-enable it and pause on the mutation. The browser supplies the evidence. An AI assistant can explain the evidence, but it shouldn't replace it.
Also check the Network panel before rewriting markup. A failed image, stylesheet, font, or script request can make a correct HTML structure appear broken. If the page behaves differently at a responsive breakpoint, reproduce the exact viewport and inspect media-query rules instead of making desktop markup carry the blame for a mobile CSS decision.
A page can pass HTML validation and still be unusable. A keyboard user may never reach an interactive control. A screen reader may announce a form field without a meaningful label. A heading sequence may look visually attractive while communicating no useful document structure.
The latest WebAIM Million analysis found detectable WCAG 2 failures on 95.9% of the world's top one million home pages, with an average of 56.1 errors per page (WebAIM Million analysis). The most common failures include missing alternative text, missing form labels, empty links, empty buttons, and missing document-language declarations. These aren't exotic edge cases. They're ordinary HTML decisions that developers can inspect directly.
Use a real <button> for an action and a real <a> for navigation. Give every form control an accessible name, usually through a correctly associated <label>, and verify that the for value matches the input's unique id. Check whether headings communicate an understandable hierarchy, not merely whether their font sizes look right.
Then test the page without a mouse. Press Tab through the interface. Can you see focus? Does it move in a sensible order? Can you open, close, submit, and recover from every interactive state? Zoom and reflow the page, then inspect the accessibility tree in DevTools. Automated tools can identify useful patterns, but they can't replace interaction testing or a screen-reader check.
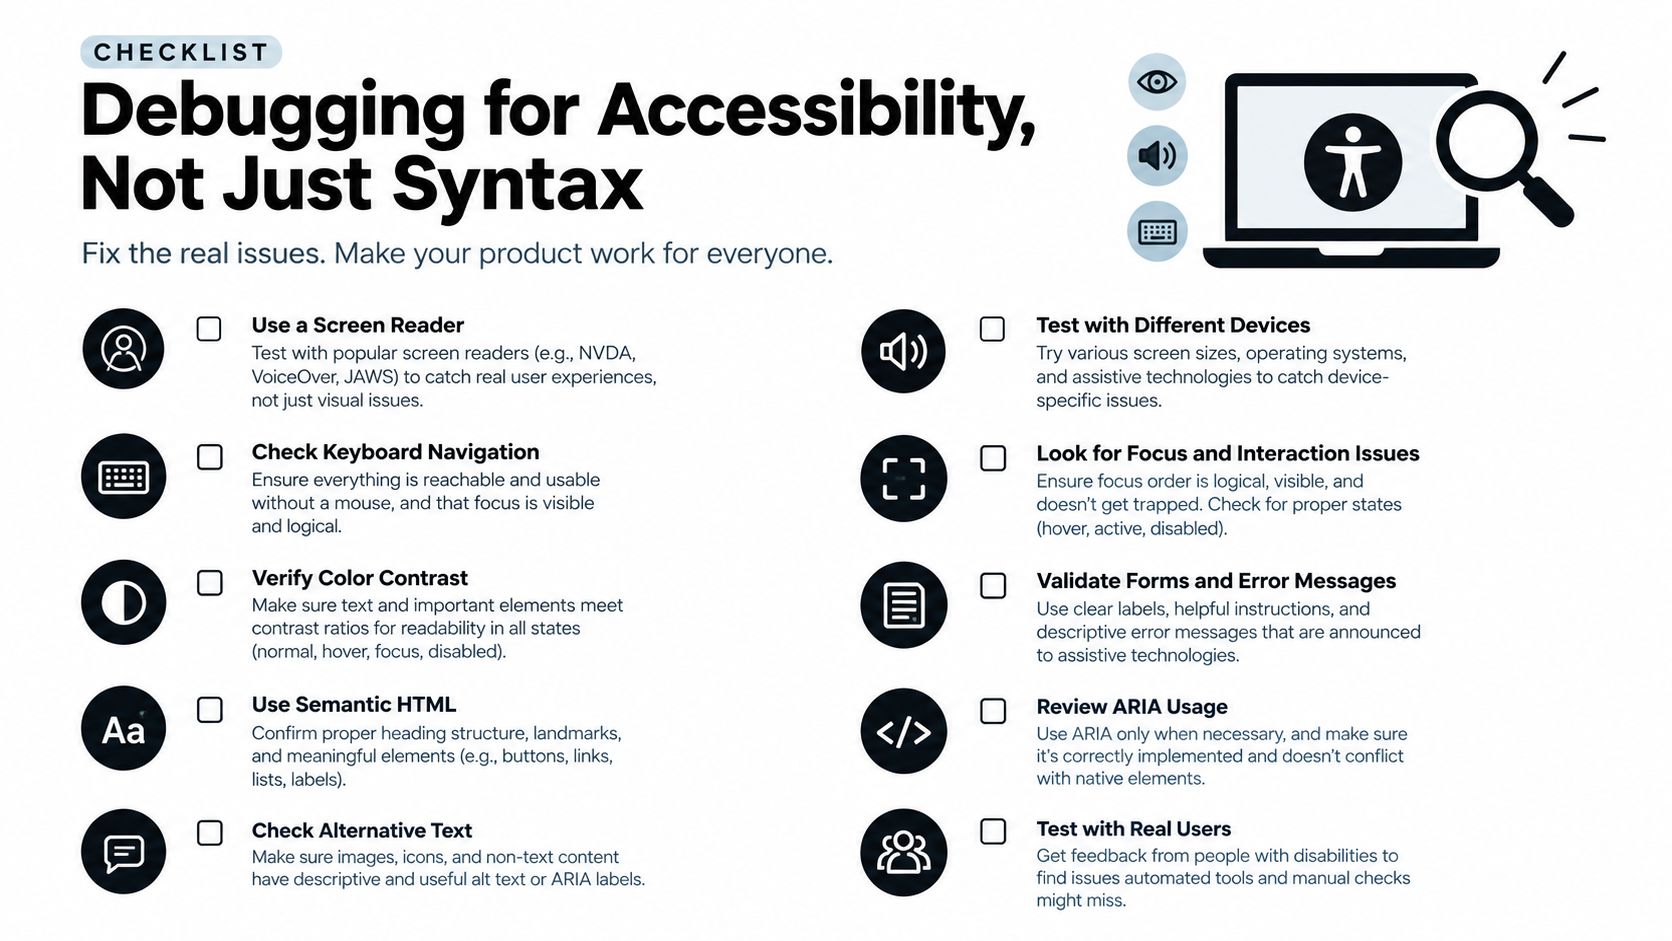
Accessibility debugging should begin with semantic HTML and real user actions, not with adding ARIA to silence a warning.
Duplicate IDs deserve special attention here. They can make a label point to the wrong field, break an in-page anchor, or cause a script to update only one of several supposedly identical controls. Before adding ARIA, fix the underlying structure. Native HTML usually carries behavior and semantics that a custom replacement must recreate carefully.
Zemith's image description guidance is a useful prompt for thinking about alternative text as communication rather than decoration. A coding assistant can review markup and suggest likely gaps, but you should confirm the result against keyboard behavior, browser accessibility inspection, zoom, reflow, and, where possible, a screen reader. Automated checks cover only part of accessibility. The user's experience is the final test.
When a page starts behaving strangely, don't open twelve tabs and begin changing random tags. Run the same compact sequence every time. A consistent process makes the bug smaller, preserves evidence, and gives teammates something useful to reproduce.
Write down the symptom in observable terms. “The form submits nowhere” is better than “the HTML is broken.” Note the route, viewport, browser, action that triggers the issue, and whether the problem survives a clean reload.
Then inspect the delivered response and the live DOM. Compare the source with the constructed tree, expand the relevant ancestors, and look for parser corrections, relocated nodes, missing children, duplicate IDs, repeated attributes, and invalid nesting. Fix the earliest structural issue before interpreting a cascade of later validator messages.
Use the browser to separate causes rather than relying on visual intuition.
display, visibility, dimensions, overflow, positioning, and responsive rules that explain the symptom.Zemith's AI debugging assistant for code fits after evidence gathering, not before it. Use it to explain a validator message, compare expected and actual markup, suggest a minimal correction, generate a focused HTML example, or turn a diagnosis into a regression test. The live preview is especially useful when the source looks reasonable but the rendered result disagrees.
A useful diagnosis has four parts: expected DOM, actual DOM, likely cause, and minimal fix.
Don't treat a green validator result as permission to stop. Valid HTML can still be hidden by CSS, changed by JavaScript, awkward to move through with a keyboard, or unusable with assistive technology. Conversely, a browser may render invalid markup well enough to hide a structural defect until a different interaction or viewport exposes it.
And yes, experienced developers still miss closing tags. The difference is that they stop blaming themselves after the first coffee and start collecting runtime evidence. HTML isn't judging you. It's just keeping receipts.
Zemith's Coding Assistant helps you generate, inspect, explain, and debug HTML with live previews and practical error analysis, so you can move from a vague browser symptom to a reproducible fix. Visit Zemith and use it alongside DevTools on your next stubborn markup problem.







Trusted by teams at






The top models, plus image, video and voice tools, in one plan.
Without Zemith
ChatGPT PlusUS$20.00Claude ProUS$20.00Google AI ProUS$19.99SuperGrokUS$30.00Perplexity ProUS$20.00 MidjourneyUS$10.00
 ElevenLabsUS$6.00Le Chat ProUS$14.99
 RunwayUS$15.00Kling StandardUS$8.80
 Gamma PlusUS$12.00
 Otter ProUS$16.99
 QuillBot PremiumUS$19.95
 Photoroom ProUS$12.99
 Quizlet PlusUS$7.99
Total if paying separatelyUS$234.70/mo
"I love the way multiple tools they integrated in one platform. Going in the right direction."
— simplyzubair
"The quality of data and sheer speed of responses is outstanding. I use this app every day."
— barefootmedicine
"The credit system is fair, models are perfect, and the discord is very responsive. Quite awesome."
— MarianZ
"Just works. Simple to use and great for working with documents. Money well spent."
— yerch82
"The organization of features is better than all the other sites — even better than ChatGPT."
— sumore
"It lives up to the all-in-one claim. All the necessary functions with a well-designed, easy UI."
— AlphaLeaf
"The team clearly puts their heart and soul into this platform. Really solid extra functionality."
— SlothMachine
"Updates made almost daily, feedback is incredibly fast. Just look at the changelogs — consistency."
— reu0691
Hand off the research, writing, design and follow-ups. Zemith picks the tools it needs and brings back finished work.
Search the web, run deep research, read files, create images and run code with GPT, Claude, Gemini, Grok and more.
Zemith keeps working in the cloud and pings you when it's done.
Notion, Linear, Canva, Airtable and more. It asks before it creates or changes anything.
Docs, slides, sheets and PDFs, ready to send.
Chain models and tools on a visual canvas, from one prompt to a finished promo video.
Briefings, reports and reminders run on a schedule and are ready when you need them.
Real-time voice that can see your camera or screen.
The best image and video models, in one studio.
Turn PDFs, links and YouTube videos into podcasts, quizzes, flashcards and mind maps.
<section class="profile"> <h2>Account</h2> <div class="details"> <p>Choose your preferences.</p> </section></div>














 Podcast
 Quiz
Quiz Flashcards
 Mind map
 Infographic